THE BIG PICTURE – Stock Market Futures
Week 51, you would have never known it was here based on it’s low volume. For some, this is the optimal market as it was rangebound for the better part of the week. I am expecting more of the same as we roll into next week, with market indices not exactly migrating higher but also not breaking through support downside.
The ever looming all time high on the Dow Jones Industrial Average (INDEXDJX:.DJI) and Futures (YM) holds above for now with it’s day sure to come. Meanwhile, keep your eyes on the hourly levels in combination with your trending strategy of choice. As stated last week, “consolidation in the indices may just be what the market needs at this point for the next move. Being ready in both directions may be your best offense.” Intraday charts may surely have a setup or two in the first 2.5 hours of the US market open. Otherwise, turn your attention to markets as in the commodities and look for opportunity. There is always the option to just relax and sit out week 52 and see what is outside that cave you bury yourself in all year.
As always, leave your bias at the door of where you think the market should be. Watch the charts in front of you and stay away from the Z-Vals. Be ready in both directions. The trend reveals itself on Heikin Ashi bars and proper trade management keeps you in the trend.
Attempting to determine which way a market will go on any given day is merely a guess in which some will get it right and some will get it wrong. Being prepared in either direction intraday for the strongest probable trend is by plotting your longer term charts and utilizing an indicator of choice on the lower time frame to identify the setup and remaining in the trade that much longer. Any chart posted here is merely a snapshot of current technical momentum and not indicative of where price may lead forward.
You can also view my market outlook video on youtube.
Markets Covered: ES, YM, NQ, CL, GC & 6E
NQ – Nasdaq Futures
Current Trend: Uptrend Pullback
Using the Murray Math Level (MML) charts on higher time frames can be a useful market internal tool as price action moves amongst fractal levels from hourly to daily charts. Confluence of levels may be levels of support/resistance or opportunities for a breakout move.
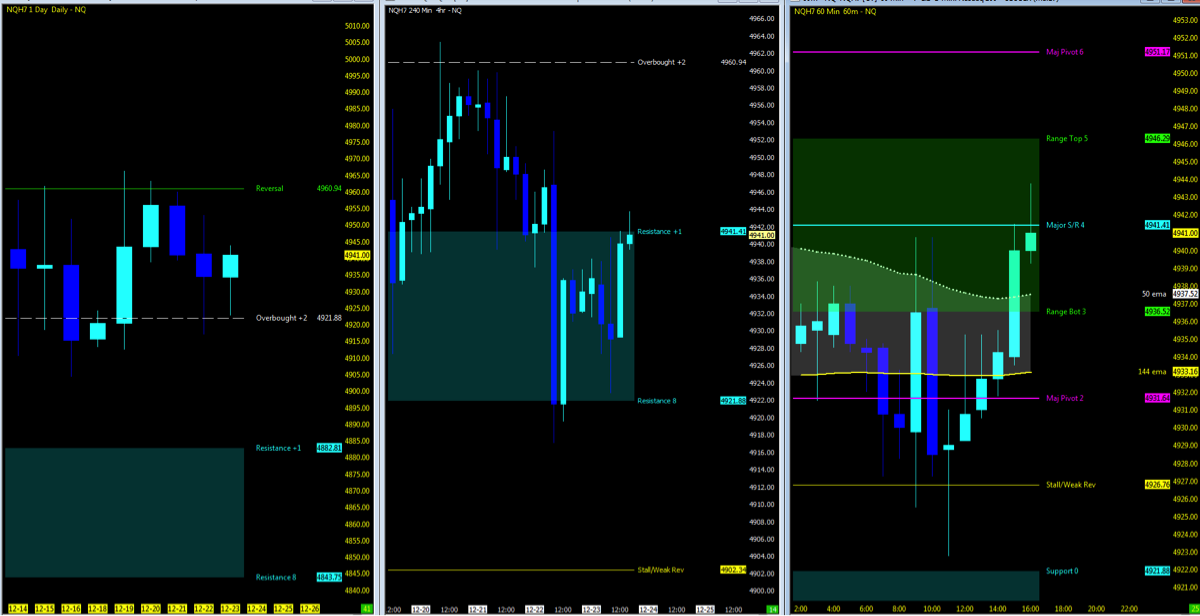
Zones to Watch
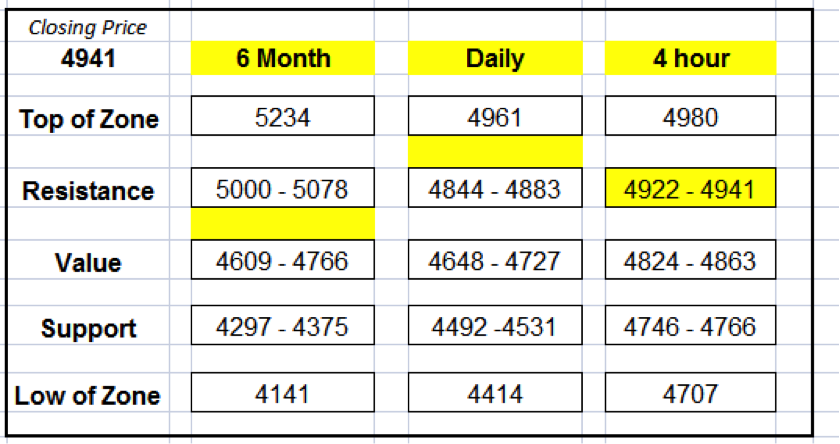
Nearest Open Daily Gap: 4882.5
Lowest Open Gap: 4017
ES – S&P Futures
Current Trend: Uptrend Pullback
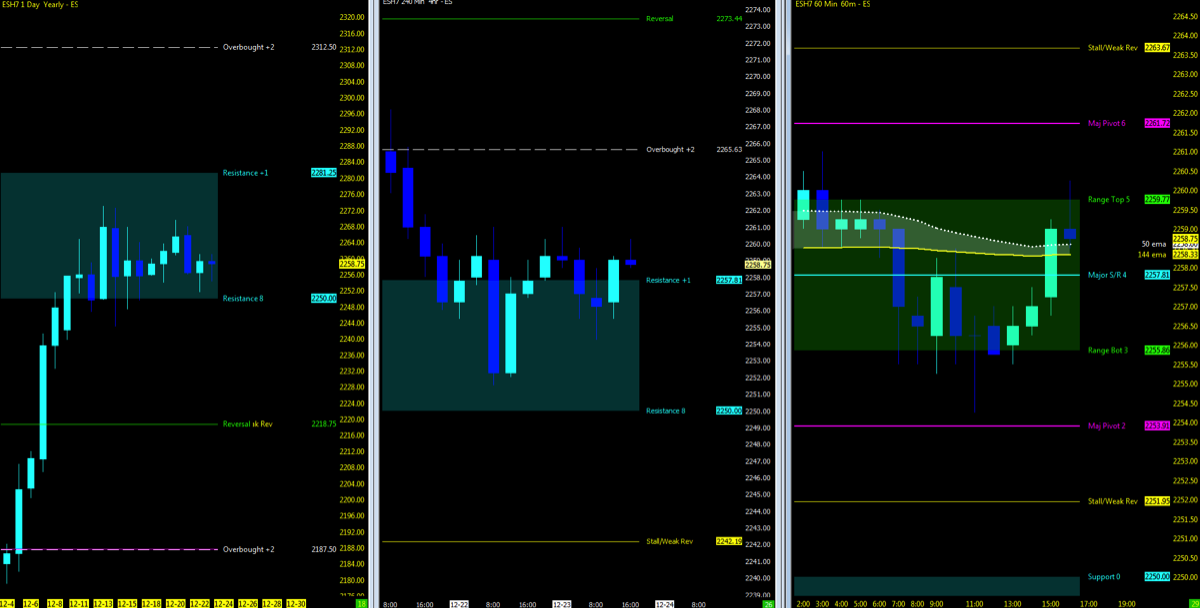
Zones to Watch
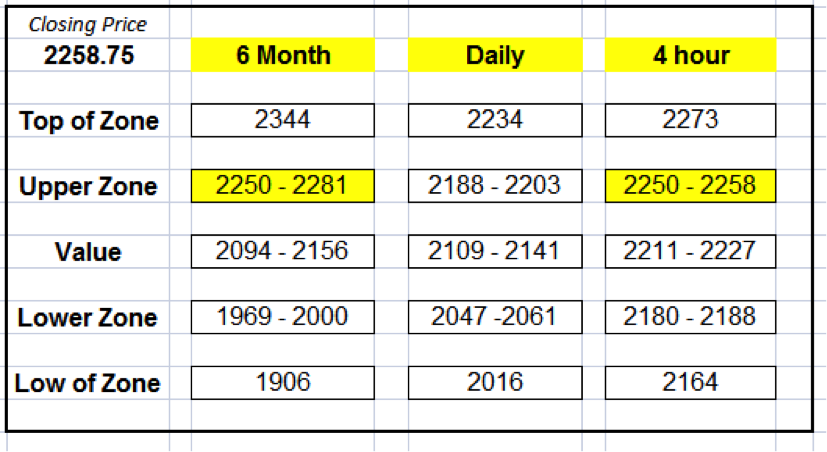
Nearest Open Daily Gap: 2197.25
Lowest Open Gap: 1860.75
YM – DOW Futures
Current Trend: Uptrend Pullback
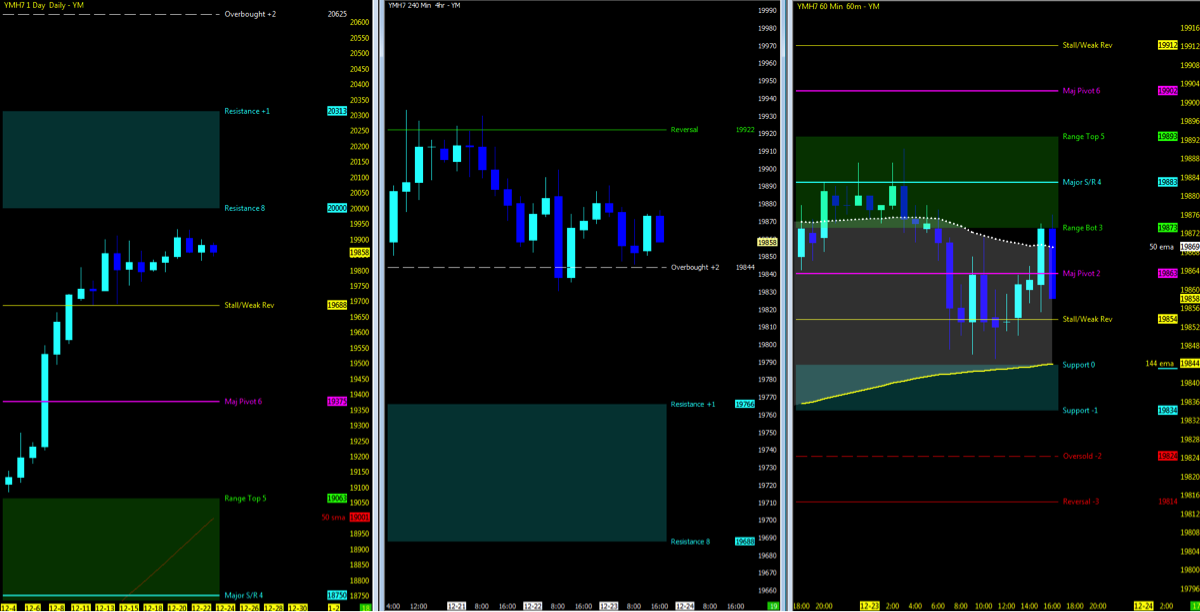
Zones to Watch
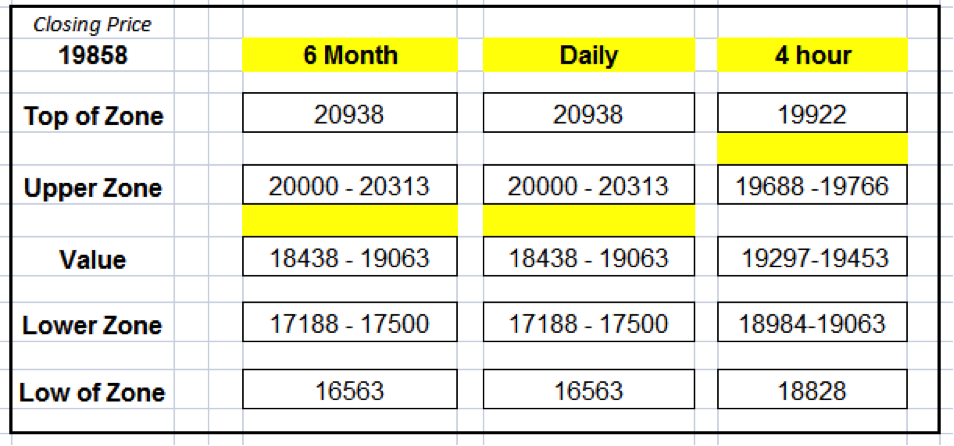
Nearest Open Daily Gap: 18929
Lowest Open Gap: 15924
Thanks for reading and remember to always use a stop at/around key technical trend levels.
Twitter: @TradingFibz
The author trades futures intraday and may have a position in the mentioned securities at the time of publication. Any opinions expressed herein are solely those of the author, and do not in any way represent the views or opinions of any other person or entity.

: Showing Some Signs of Emerging Strength")
