The Big Picture – Stock Market Futures
Considering all the hubbub and uncertainty that filled the air in 2016 about the presidential election and Federal Reserve, well both came and went and the market is at all-time highs. Last week traders navigated an expected FOMC announcement of a rate hike and Quad witching options.
Currently, the major stock market indices remain near all time highs despite a small pullback on the FOMC announcement. As volume now rolls into the March contract the ever looming Dow 20,000 and NQ 5,000 may help the market lift a bit higher.
As in any outlook, there is a case to be made for price action in either direction. With countless open gaps below surely at some given time the market will retreat and traders will take profits off the table. That said, relentless markets may also continue higher when at the highs. Consolidation across the stock market indices will lead to our next move. Be ready in both directions.
As always, leave your bias at the door of where you think the market should be. Watch the charts in front of you and stay away from the Z-Vals. Be ready in both directions. The trend reveals itself on Heikin Ashi bars and proper trade management keeps you in the trend.
Attempting to determine which way a market will go on any given day is merely a guess in which some will get it right and some will get it wrong. Being prepared in either direction intraday for the strongest probable trend is by plotting your longer term charts and utilizing an indicator of choice on the lower time frame to identify the setup and remaining in the trade that much longer. Any chart posted here is merely a snapshot of current technical momentum and not indicative of where price may lead forward.
NQ – Nasdaq Futures
Current Trend: Uptrend Pullback
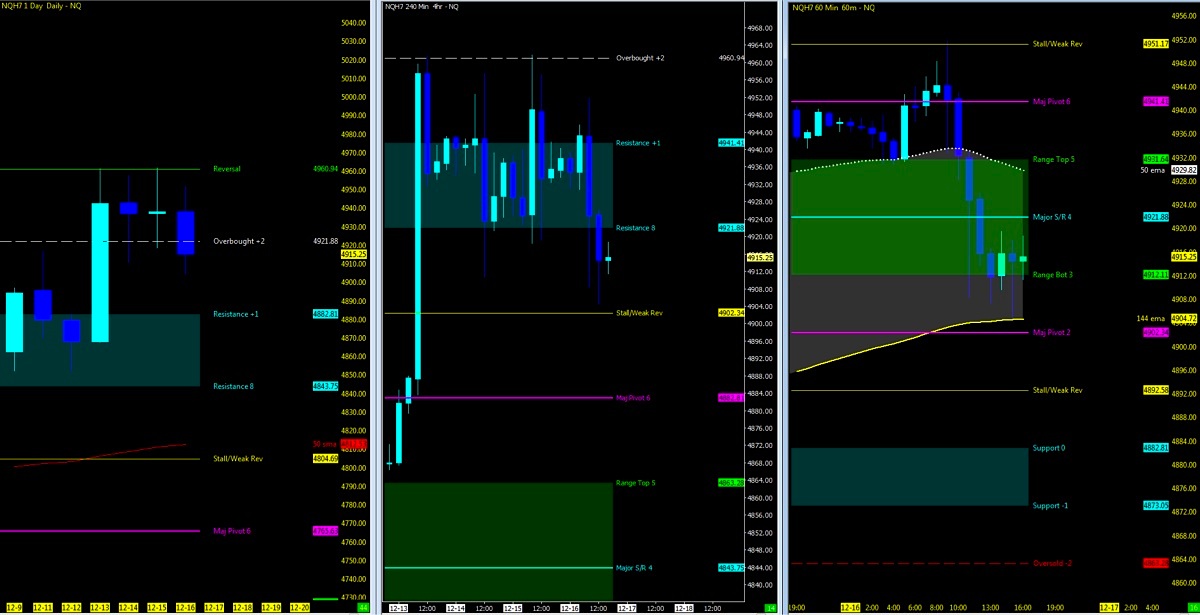
Using the Murray Math Level (MML) charts on higher time frames can be a useful market internal tool as price action moves amongst fractal levels from hourly to daily charts. Confluence of levels may be levels of support/resistance or opportunities for a breakout move.
Hourly charts (right) finding support at the 50/144ema cloud and bottom of value on the pullback on Friday. If price action is to break here, look to support downside for a bounce. This would line up with the 4hr Major pivot and top of resistance on the daily. 4863 to the daily 50ma would be the lowest levels at this juncture before the market may find a buying opportunity. Watch for the breakout above 4941 to a stall at 4960 before heading to 5K.
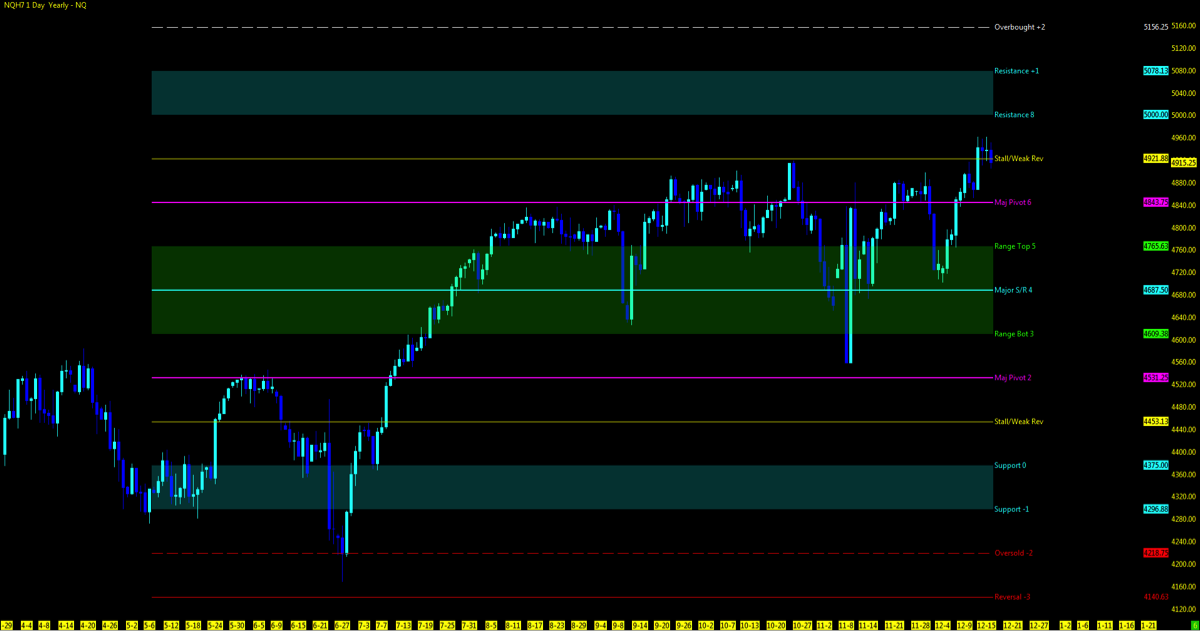
Six month view of the NQ off the lows of June, 2016 seen below reaching to the highs of the year as 5K is just a handle away at the resistance above.
Zones to Watch
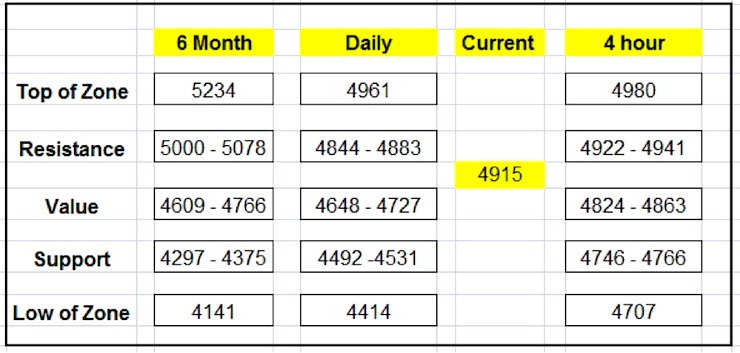
Nearest Open Daily Gap: 4882.5
Lowest Open Gap: 4017
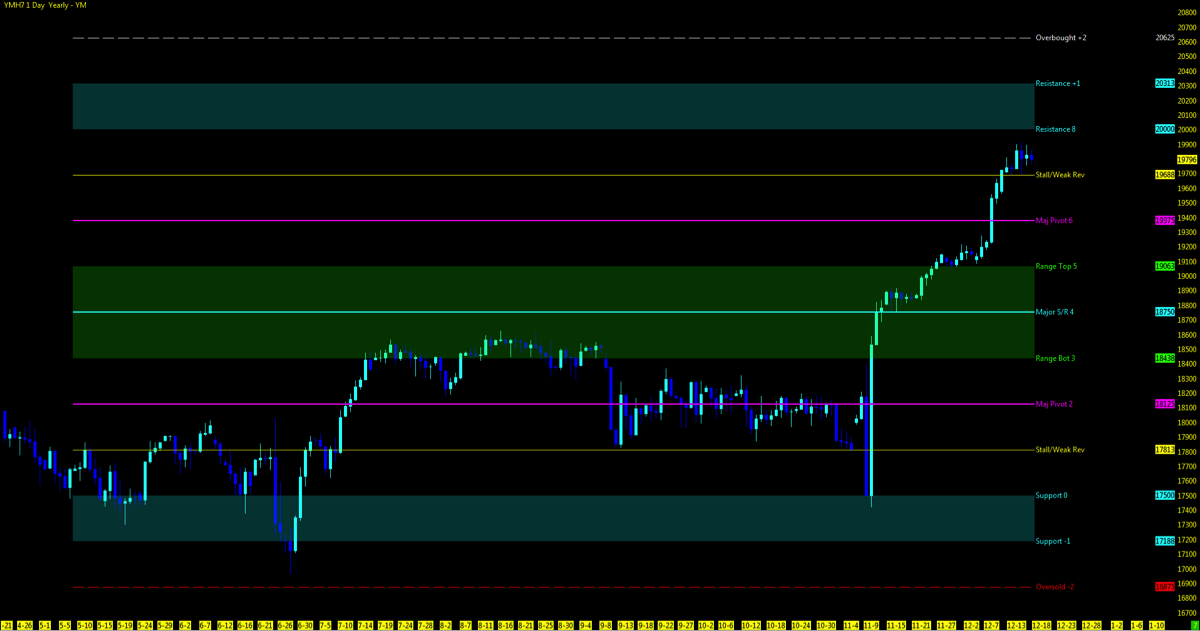
ES – S&P 500 Futures
Current Trend: Uptrend Pullback
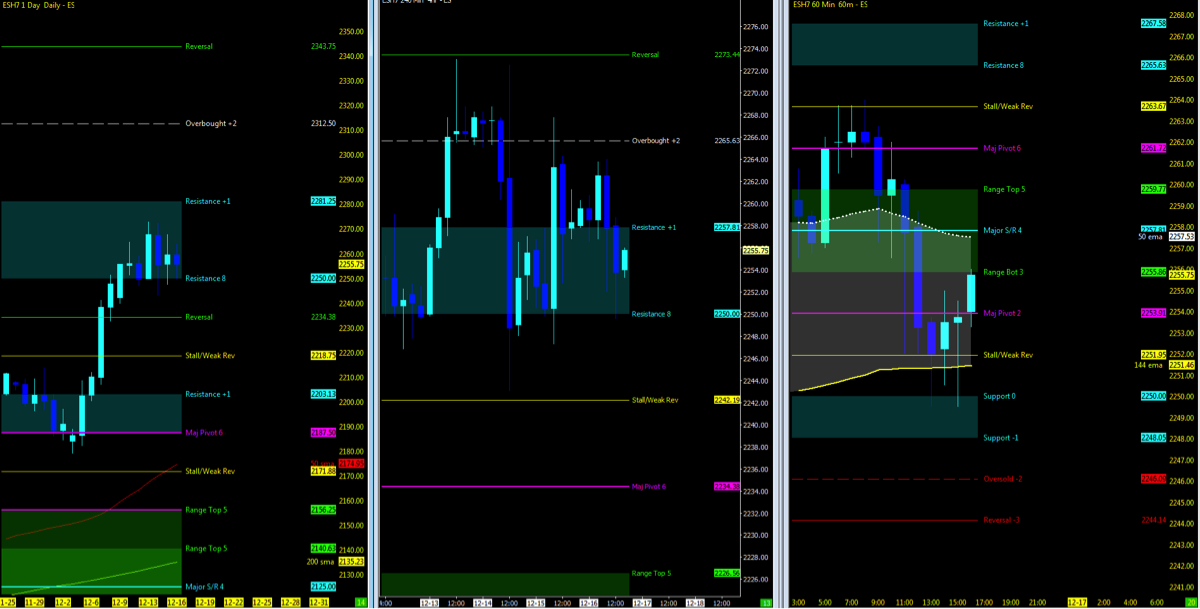
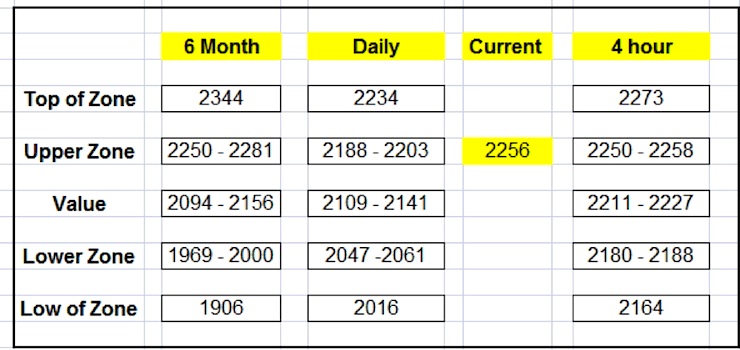
Price action on Friday, finding support off the hourly and 50/144ema may be just what the ES future needs to head upside as the daily upper levels have been breached. Watch the 2265 as the first level of resistance as price heads to 2281 on the 6 month chart below. 2259 is the breakout level to gain momentum to the upside. If unable to hold here and price action breaks down, 2244 is the level to watch. Probability which currently is leading upside, as the hourly 50 is above the 144ema and daily chart holding above the highs. Look to the 6 month chart for the daily long term upper levels if price is to head higher.
Appreciation on the 6 month chart as the ES off the support levels downside have climbed to resistance and consolidation in week 50.
Zones to Watch
Nearest Open Daily Gap: 2197.25
Lowest Open Gap: 1860.75
Thanks for reading and remember to always use a stop at/around key technical trend levels.
Don’t forget to view the end-of-the-day charts as momentum in the markets can shift substantially from day to day and reset any charts posted above.
Twitter: @TradingFibz
The author trades futures intraday and may have a position in the mentioned securities at the time of publication. Any opinions expressed herein are solely those of the author, and do not in any way represent the views or opinions of any other person or entity.


: Showing Some Signs of Emerging Strength")
