THE BIG PICTURE – Stock Market Futures
Week 49 brought about a relentless pursuit of higher highs in the stock market indices. Nasdaq futures (NQ) soared back from its late November selloff to reach new highs. Stock market futures were also aided by the suddenly energized Dow Jones Industrials & Transports.
The rally in the Transports has helped the Dow Jones push toward 20K.
And the S&P 500 is also marching to higher highs. With the volume rollover now in the hands of the March Futures (ES) contract, it will be interesting to see the market’s reaction to the Federal Reserve meeting (which is most likely priced in already). After such a big rally into December, is there any rally left for this week? Quad-witching at the end of the week will bring all volume back into March contracts. Who knows, perhaps this will bring an opportunity for the markets to take some profits after a big run up in week 49 leads us into week 50.
As always, leave your bias at the door of where you think the market should be. Watch the charts in front of you and stay away from the Z-Vals. Be ready in both directions. The trend reveals itself on Heikin Ashi bars and proper trade management keeps you in the trend.
Attempting to determine which way a market will go on any given day is merely a guess in which some will get it right and some will get it wrong. Being prepared in either direction intraday for the strongest probable trend is by plotting your longer term charts and utilizing an indicator of choice on the lower time frame to identify the setup and remaining in the trade that much longer. Any chart posted here is merely a snapshot of current technical momentum and not indicative of where price may lead forward.
NQ – Nasdaq Futures
Current Trend: UPTREND
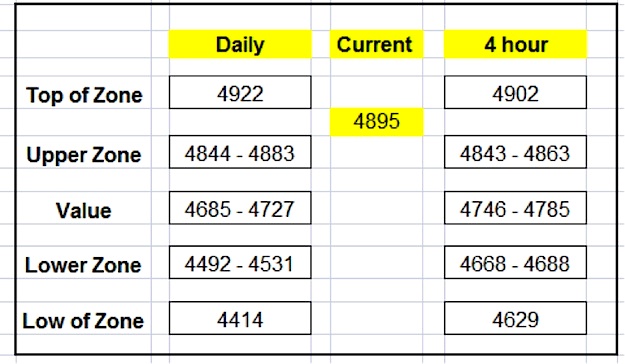
The daily chart has broken through to the other side. I highlighted in my midweek outlook that a move above the 50 day ema was all the index needed for higher highs to the 4882 level. With the majority of volume now in the March contract and with price action back above of the 50 day ema, price action rises into the 4902-12 zone before a pullback to the 4765 area. Don’t count out a 50% Fibonacci pullback or at least a close of the open gap set on Friday. Downside, price may have resistance as low as @ the hourly 50/144ema. To the upside, if price is able to break this zone, 4960 is my current high. At that level why not go for 5K on the futures! Always watch the intraday charts for momentum of TREND on the Heiken Ashi bars.
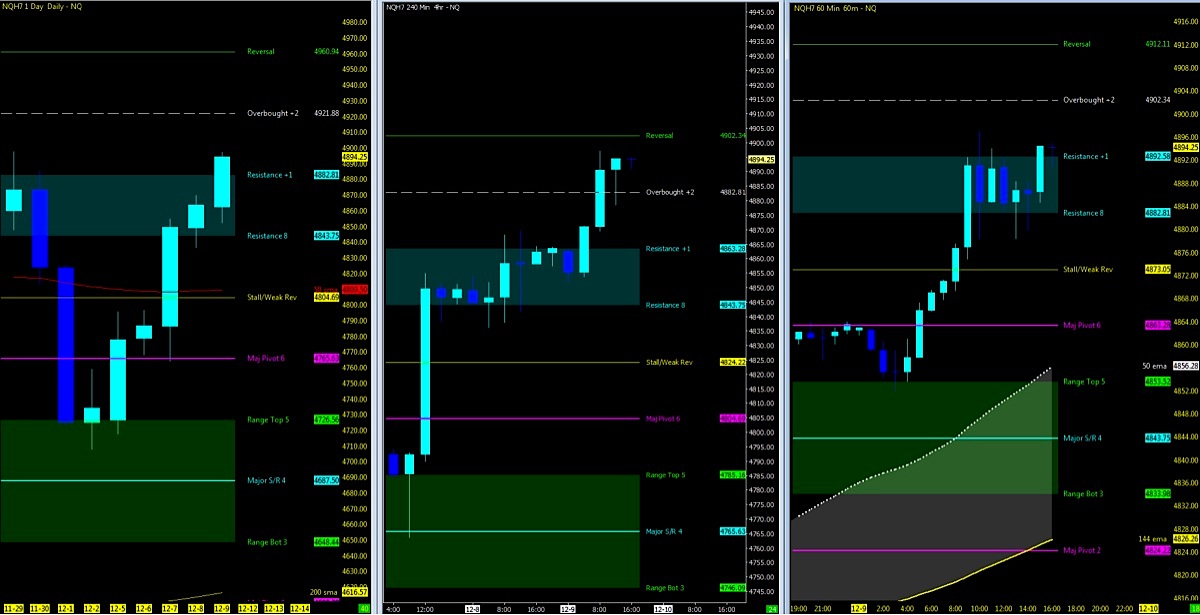
Zones to Watch
Nearest Open Daily Gap: 4868.5
Lowest Open Gap: 4017
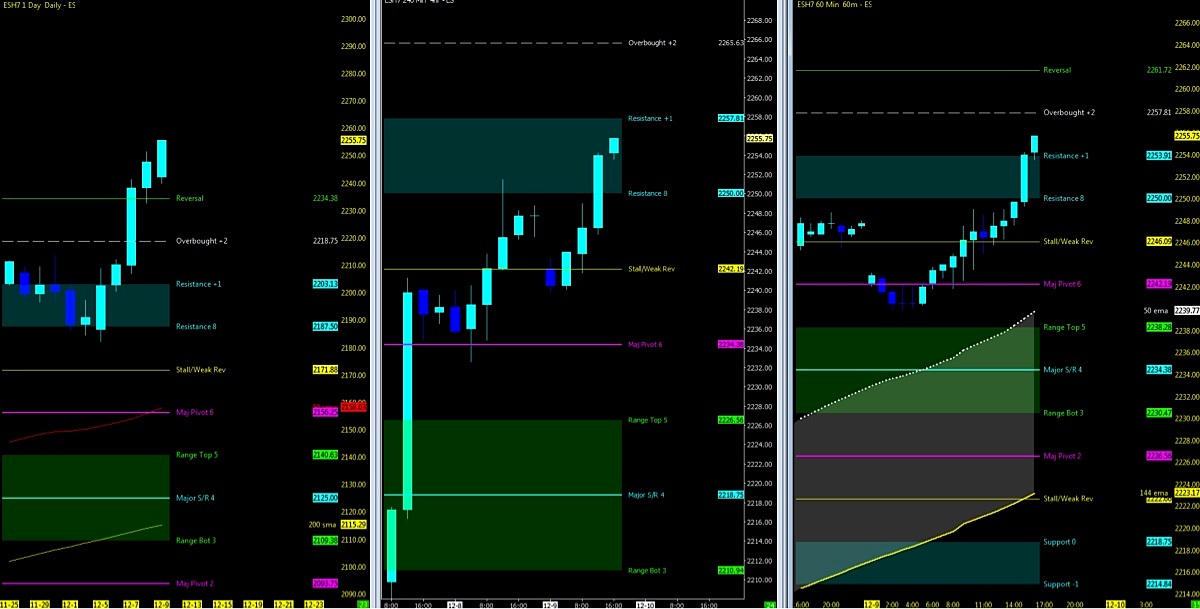
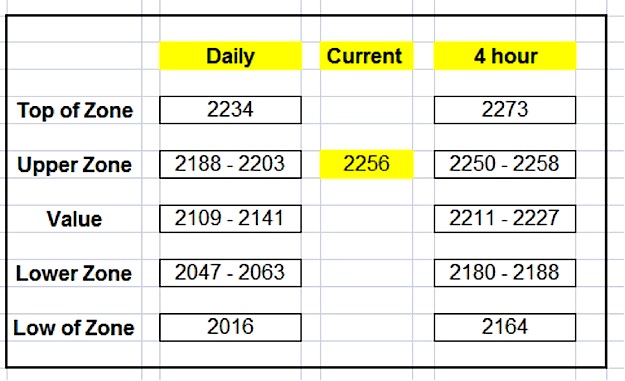
ES – S&P Futures
Current Trend: UPTREND
Looking to the upside, the S&P 500 futures with a possible scenario of resistance at 2257 may be the first stall we get if price action is to lift. The current high of 2265-73 on the 4 hour chart would be a level to watch if momentum is to move in that direction. To the downside, 2242 may be the first pit stop if price is to hold around 2257 and turn down. Any further selloff would test the 1 hour 50/144ema cloud which could put the ES down to 2234. Watch for support at the 50 day ma. Probability is that we remain solid in the uptrend with several mini-pullbacks until we break below the 50/144ema on an hourly chart, retest the 144 on a pullback and head lower (starting downtrend). Note that the last pullback only lasted 5 days and never retested the 144ema.
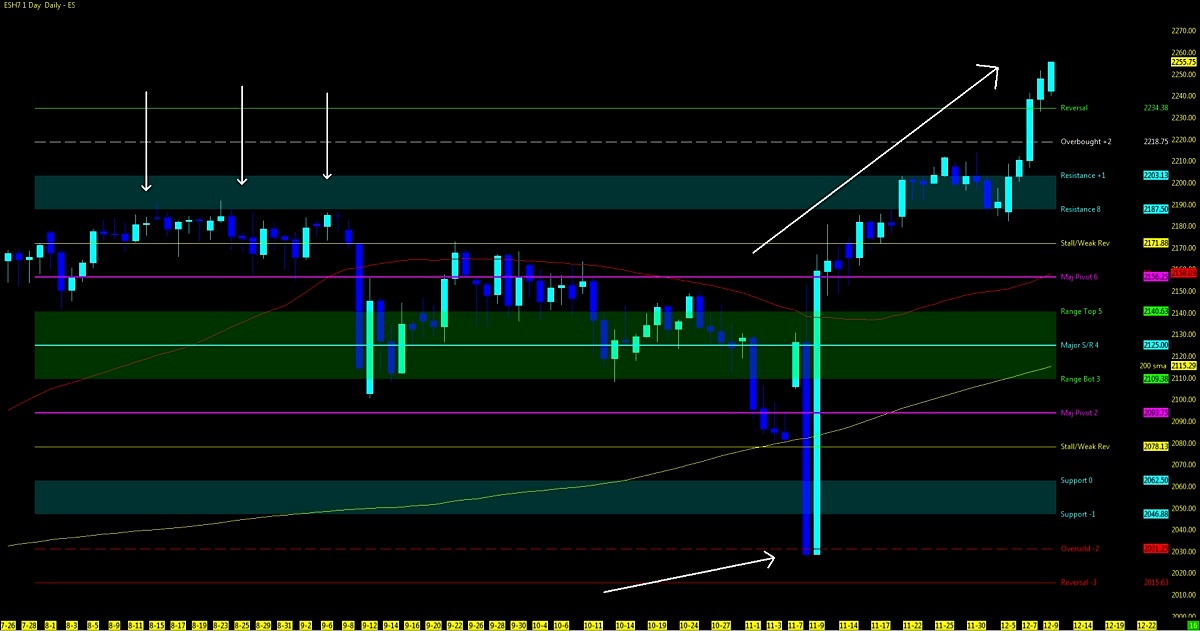
- How to identify the opportune time for a pullback or trend change entry? Watch the higher time frame for levels of support or resistance as seen below on the MML chart, and in combination with any trending study or candles, remain in the trend. If for instance one wanted to trade/invest in the S&P 500 ETF (SPY) as a proxy for the S/P futures, the pullback to the oversold level was an opportune time, and on a lower time frame to scale in to the bounce off the lows. At this juncture, waiting for the next pullback would be optimal on a lower time frame (1-4hr) to the upside.
Zones to Watch
Nearest Open Daily Gap: 2197.25
Lowest Open Gap: 1860.75
Thanks for reading and remember to always use a stop at/around key technical trend levels.
Twitter: @TradingFibz
The author trades futures intraday and may have a position in the mentioned securities at the time of publication. Any opinions expressed herein are solely those of the author, and do not in any way represent the views or opinions of any other person or entity.


