THE BIG PICTURE
2017, not exactly off to a great start.
Indices continue to consolidate at the highs as the market refuses to run away in either direction. That said, there’s micro-pockets of opportunity on any given day, so (frustration aside) patience is the key here.
Could it be that the market may just be waiting for “Trumpenomics” to lay the ground for where we may be headed next? At some point, markets will either recoil and pullback or head higher… and traders should be ready for either direction.
Over the first four weeks of 2017, I have laid the foundation for where and what may be the catalyst. At this point, and by the charts alone, my technical indicators will be the guide as to where the highest probability trend may be.
Whether it’s Fibonacci or Murray Math levels (MML) or for that matter, any fractal line, the market is surely to test either side. To the downside, the 50 period moving averages closing in as the MML resistance levels hold. Technical momentum probability still remains at this point to lead us higher on the bigger pic (in my humble opinion). But that can change fast.
You may continue to tune in to the “perma-bears” and miss any continued run up in the market while awaiting a correction to the downside. By now, there is no harm in holding here as we slide sideways and await a new trend. But traders need to tune out the bias to succeed.
Watch for MSFT, GOOG , SBUX earnings this week along with GDP to wrap up the week. The VIX strike prices of 21/22 for Feb 15 is something to take into consideration as well.
Note that you can also view my market outlook for ES, YM, and NQ on YouTube.
Attempting to determine which way a market will go on any given day is merely a guess in which some will get it right and some will get it wrong. Being prepared in either direction intraday for the strongest probable trend is by plotting your longer term charts and utilizing an indicator of choice on the lower time frame to identify the setup and remaining in the trade that much longer. Any chart posted here is merely a snapshot of current technical momentum and not indicative of where price may lead forward.
NQ – Nasdaq Futures
Technical Momentum: UPTREND
Using the Murray Math Level (MML) charts on higher time frames can be a useful market internal tool as price action moves amongst fractal levels from hourly to daily charts. Confluence of levels may be levels of support/resistance or opportunities for a breakout move.
- Top Row: Weekly, Daily; 4hour
- Bottom row: 60m, 15m
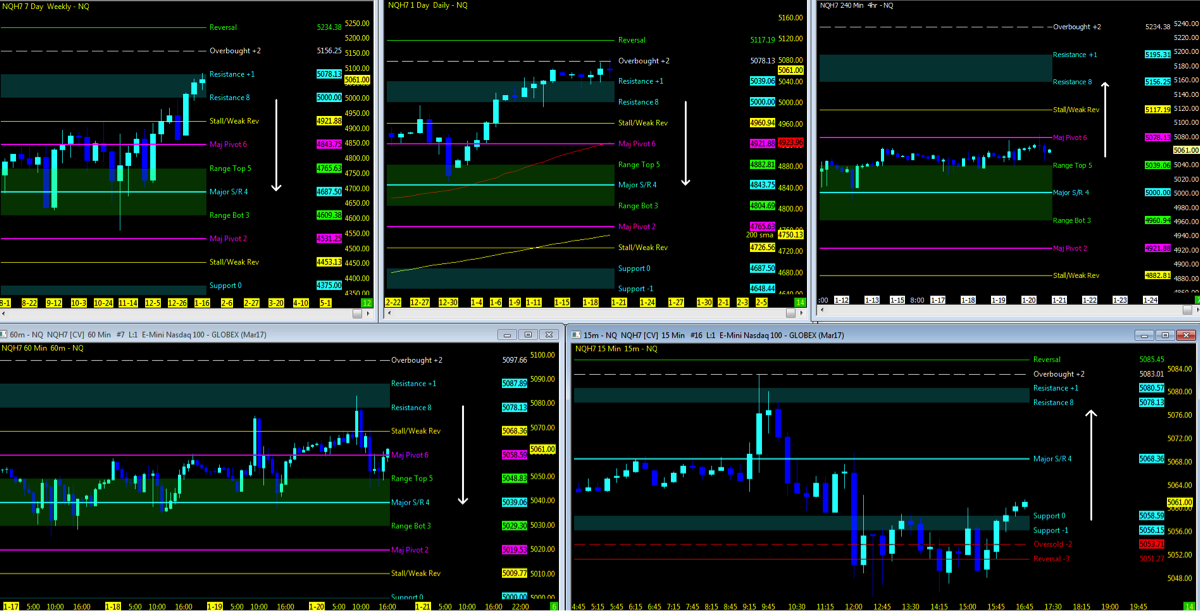
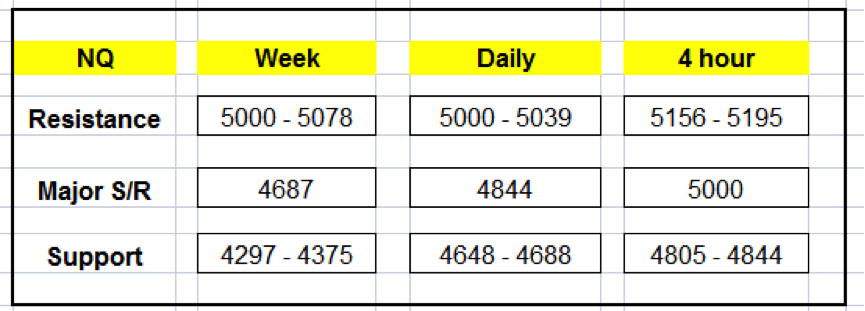
Levels to Watch
- Upside: 5156 if we hold above 5078
- Downside: 5000 (50ma below)
- Major S/R: 4844 (50ma above)
MML Levels (NQ)
Nearest Open Daily Gap: 4610.75
Lowest Open Gap: 4017
ES – S&P Futures
Technical Momentum: UPTREND
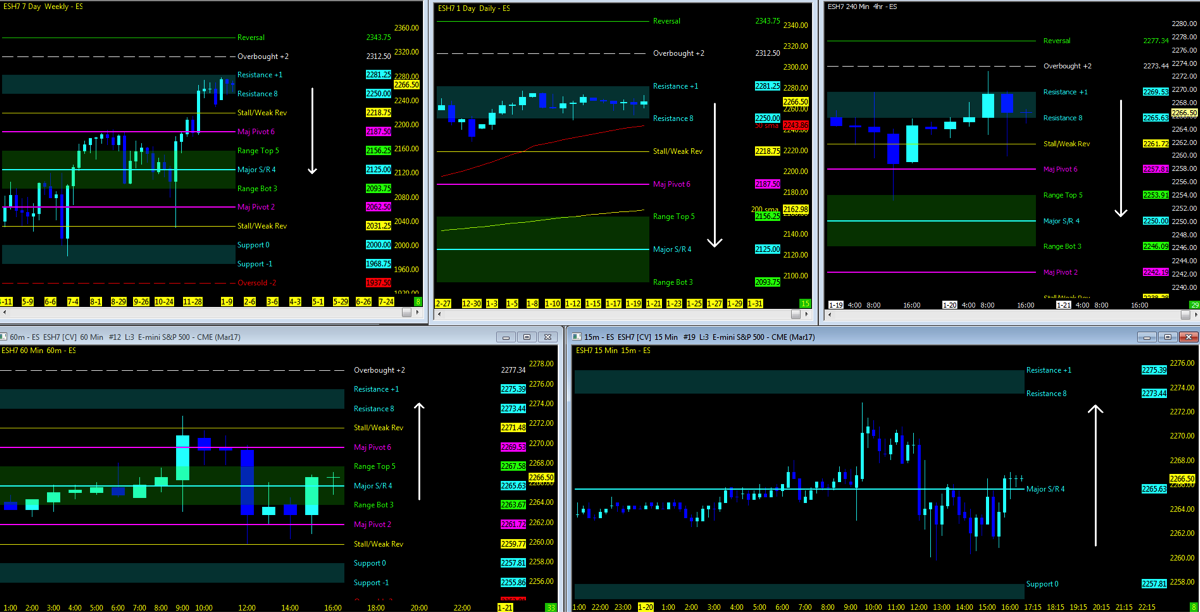
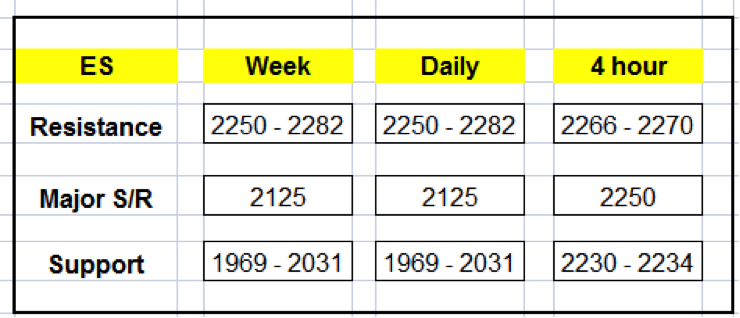
Levels to Watch
- Upside: 2281 (watch 2273 resistance)
- Downside: 2250 (50ma below)
- Major S/R: 2125 (200ma above)
MML Levels (ES)
Nearest Open Daily Gap: 2197.25
Lowest Open Gap: 1860.75
YM – DOW Futures
Technical Momentum: UPTREND
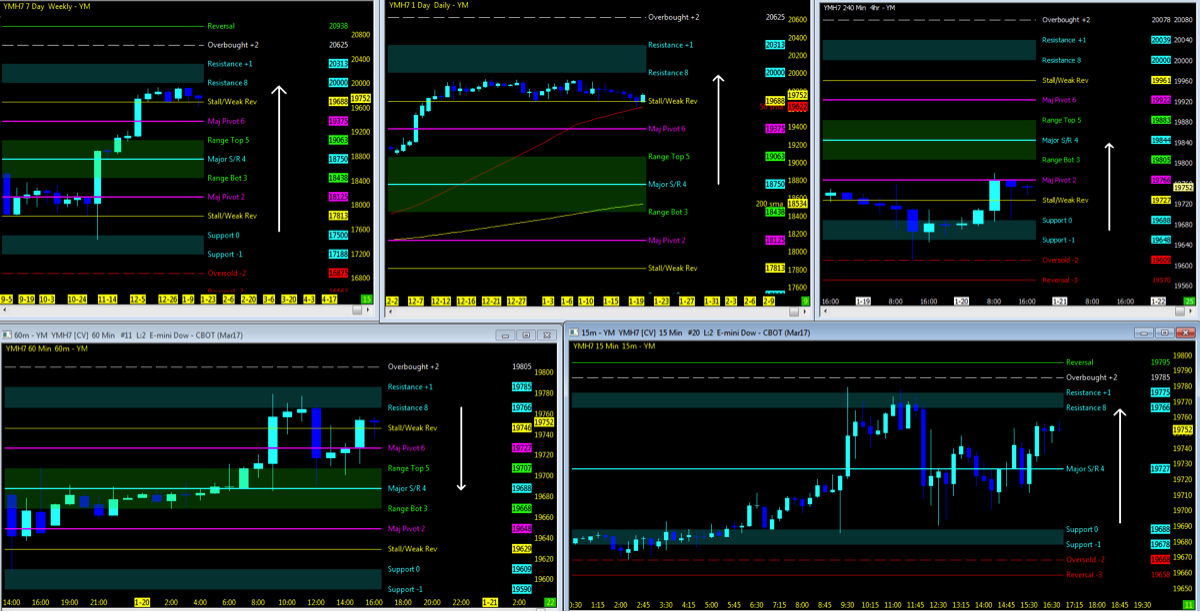
Levels to Watch
- Upside: 20000
- Downside: 19688 (50ma below)
- Major S/R: 18750
MML Levels (YM)

Nearest Open Daily Gap: 18929
Lowest Open Gap: 15924
Thanks for reading and remember to always use a stop at/around key technical trend levels.
Twitter: @TradingFibz
The author trades futures intraday and may have a position in the mentioned securities at the time of publication. Any opinions expressed herein are solely those of the author, and do not in any way represent the views or opinions of any other person or entity.

: Showing Some Signs of Emerging Strength")

