THE BIG PICTURE: Pullback…short lived!
No, it couldn’t be. I can’t remember the last price action to the downside of more than 50 ticks and it FINALLY happened to us this past week. However, as with any relentless TREND, it was short lived and the market managed to not only recover in the same day but almost back up to all time highs to close out the week.
If you have been following my analogy of the Orange Squeeze the last several weeks, it appears we have found some more pulp out of this market. Last week I alluded and entertained the idea that the market may actually ease off a bit. Well, at least a one day reprieve was good enough to satisfy that palette. However it seems apparent (at this point) that the orange has more “juice” in it.
I remain quite amazed at the plethora of articles/posts/tweets that continue to flood the market of hatred and despair of how can this market continue to move up with internals not in sync and volume not matching the history of a move such as the one we are in. But, for weeks on end they have been wrong.
So let’s put this to rest – here’s my 3 cents. Day and day out, I reiterate to leave your BIAS at the door when trading and ONLY watch the charts in front of you. This is best defined as, no matter where you think the market should be, watching trend each day and being ready in both directions. It will keep your emotions out of the ongoing permabear influence and have you focused on making ticks. Whatever strategy you may have, it is recognizing the market will move where it wants and you have NO CONTROL over it. The only piece you can manage is your process and risk management.
I can throw at you several books to read and posts by Steve Burns that will simply reiterate what patient and disciplined traders alike are instilled with. I think many active investors would prefer the market to pull back and close out the lower open gaps before moving higher. That sounds nice, but until that time, I’m happy knowing what the trend looks like and seeking setups with trade management that allow me to ride the trend wave.
Week nine appears to be a bit heavier on the economic front than week 8. Tax reform announcement, March contract expiration nearing, GDP, non-farm payrolls, multiple fed reserve speakers and the prospect for a next rate hike are all upcoming economic events that remain on my radar alert.
Technically, we remain near the highs with serious open gaps below. VIX levels remain low and almost pointless of indicating when the market will finally turn. The daily charts on the indices clearly paint that picture as we hold above the respective 50/200 day moving averages. The 4 hour MML charts which support the bigger trend on a lower time frame also remain at the highs and continue to remain in a very tight range. The globex sessions which have been a solid ground for trend setups with the London open, but never indicative of where we are headed in the US session (a great example from at least two days this past week). As we continue to push at the highs, and looking to the smaller time frames for every inch of how much more it can go, has been my most reliable indicator by use of the Heikin Ashi trend bars on both the range charts and 15/60m MML levels.
The Bottom Line
This is a tough one to swallow but until the market shows evidence of distribution, there is only one TREND at this point.
Technical momentum probability CONTINUES to lead us higher on the indices on the bigger picture. That said, watch your trending indicators if we pull back again.
I state with caution as seen in the charts below we are at a technical momentum decision time as we have been week after week based on my strategy that puts price action in a stall at these upper levels. I will be ready to alert of the change in trend or continued movement upside through social media and my daily outlook; 15 minutes prior to the open.
For the Indices ETF or long term holder, different rules may apply as quarterly re-balancing is my preference for managing such markets. Option to move trailing stops to key MML, Fibonacci or moving average levels can lock in more profit if and when a pullback may occur. Placing a 250 sma on your daily/longer term range charts can be one useful indicator before institutional support and taking in more profit.
Note that you can also view my market outlook for ES, YM, and NQ on YouTube.
Attempting to determine which way a market will go on any given day is merely a guess in which some will get it right and some will get it wrong. Being prepared in either direction intraday for the strongest probable trend is by plotting your longer term charts and utilizing an indicator of choice on the lower time frame to identify the setup and remaining in the trade that much longer. Any chart posted here is merely a snapshot of current technical momentum and not indicative of where price may lead forward.
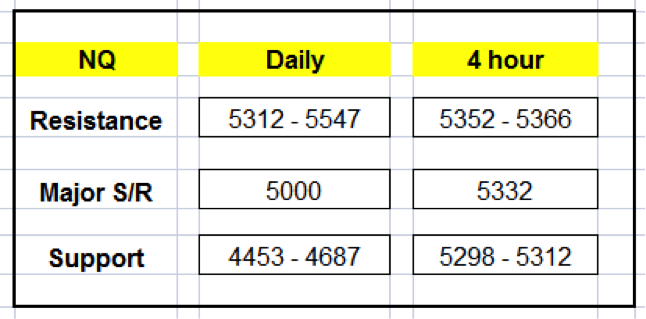
NQ – Nasdaq Futures
Technical Momentum: UPTREND
Using the Murray Math Level (MML) charts on higher time frames can be a useful market internal tool as price action moves amongst fractal levels from hourly to daily charts. Confluence of levels may be levels of support/resistance or opportunities for a breakout move.
CHARTS: Daily; 4 hour
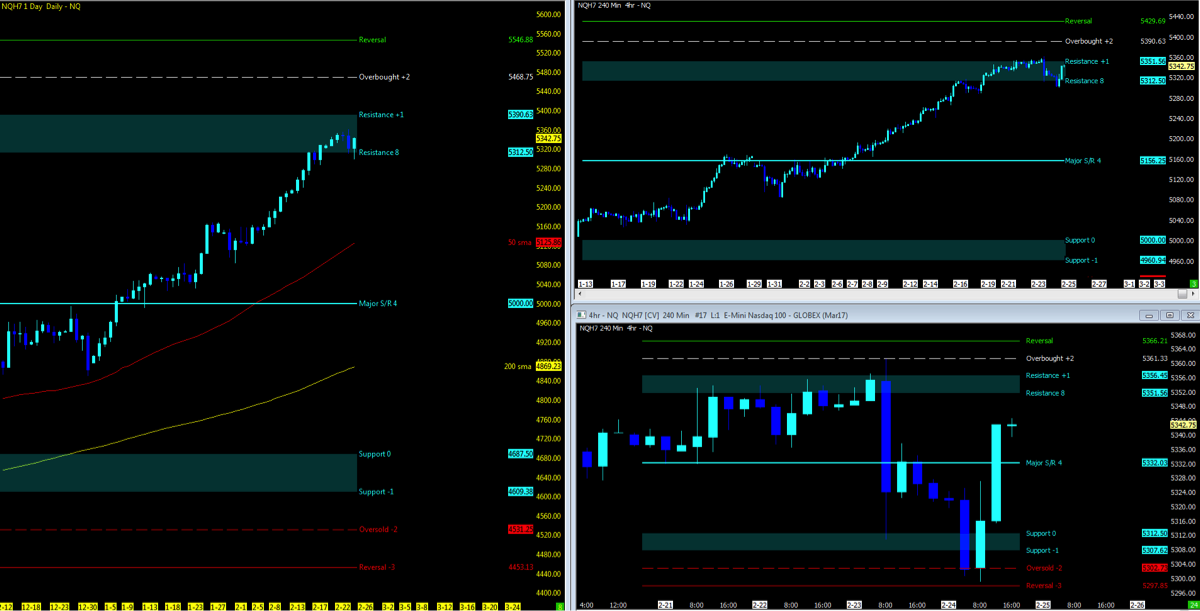
MML Levels (NQ)
NASDAQ Trading Levels TABLE
Nearest Open Daily Gap: 5232.5
Lowest Open Gap: 4017
ES – S&P Futures
Technical Momentum: UPTREND
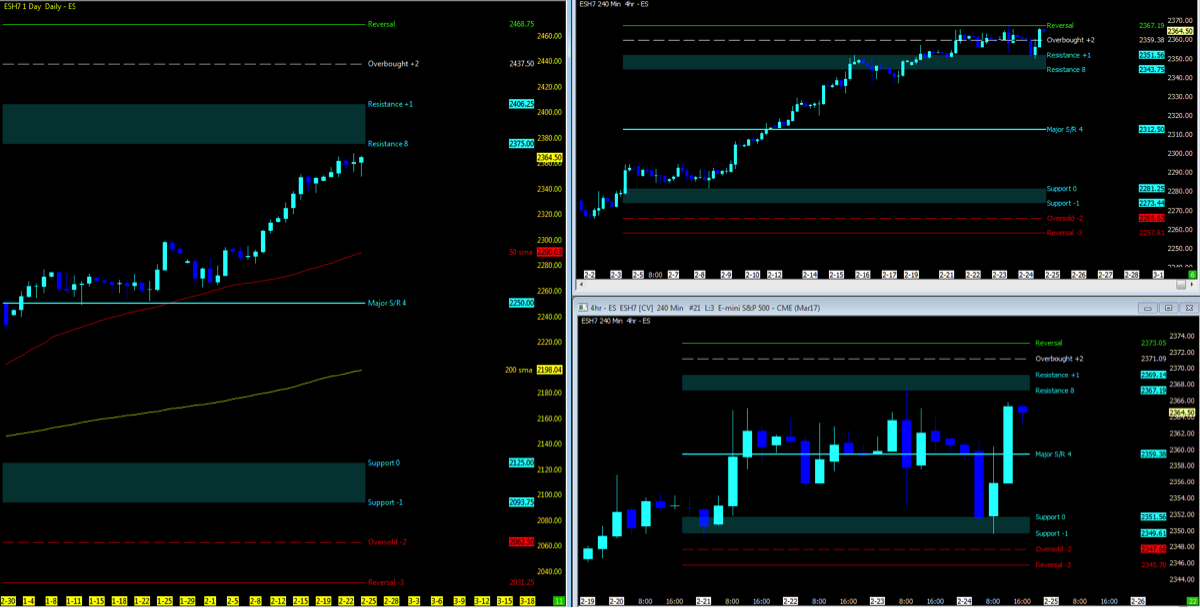
MML Levels (ES)
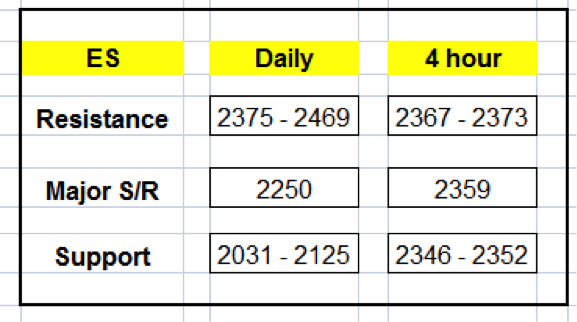
Nearest Open Daily Gap: 2348.75
Lowest Open Gap: 1860.75
Thanks for reading and remember to always use a stop at/around key technical trend levels.
Twitter: @TradingFibz
The author trades futures intraday and may have a position in the mentioned securities at the time of publication. Any opinions expressed herein are solely those of the author, and do not in any way represent the views or opinions of any other person or entity.


