THE BIG PICTURE
Relentless.
The indices roaring to new highs three out of the five trading days this past week… and with no regard to even entertaining the possibility of any self correction. This is a pattern we have become accustomed – to the bewilderment of many. With 2017 not giving more than a 1% move in the ES daily, finally breaking out on Thursday to lead the indices higher helped to make week six another historical week.
Each week, I point to the catalysts that may spawn a move in either direction and yet another week of grinding in the AM sessions to the eventual breakout, can lead the intraday technical trader to question on any given day, is this the day we pullback? I can’t stress enough to leave the bias at the door and simply watch the charts in front of you and not “guess” if this is the day. Leave the emotions aside of we can’t be this high in the market as we have experienced a runaway train that seems to not let up.
Article after article, post after post, tweet after tweet, the common thread that we just can’t push the market any higher becomes daunting. Reminds me of the ever-looming year 2K where the world was going to fall apart, and planes would fall out of the sky. We seemed to have survived. If I had subscribed to this thinking back in November, 2016, I’d still be sitting on the sidelines. Now don’t get me wrong. I am as ready as anyone else for the market to pullback, close out open gaps below, and reset itself to move even higher. However, it is not for me to guess the WHY we are at the highs, but to simply be ready for both directions. This is the benefit to the intraday trader.
The following analogy best describes how I see the market these days. If you imagine one squeezing an orange for a cup of juice to quench their thirst, it would not take but a moment to get the essence of the orange in the glass. For some, taking an extra moment to squeeze even more, will render a fuller glass. Then there are those that will peel the entire orange and get every bit of pulp out which takes time. This is where in my opinion we sit technically on the indices. We have squeezed quite hard and while we have gotten alot of juice out of the market, there is still more pulp to squeeze as every day still opens an opportunity with a level upside on either the MML or Fibonacci levels. Sure, there are those that are screaming, there is nothing left to squeeze, but until I have gotten every part out of that fruit, we stay the course.
I surely can make the case that we head higher in week 7 with momentum clearly holding the course and intraday pullbacks being bought right back up to close upside or flat however, on the economic front for week seven, I walk tepidly in the first half of the week and await the reaction in the second half. Monday is light on the economic front followed with testimony by Chair Yellen on both Tuesday and Wednesday with the posse of fed speakers as well that can light up the ALGO’s searching for any key word that may be dropped in hints of rate hikes for 2017. Throw in the VIX open strike prices of 21-23 for Feb15 with over 1 million open interest, may just what the market needs to pullback.
Bottom Line
Technical momentum probability CONTINUES to remain at this point to lead us a higher on the indices “with EXTREME caution” on the bigger pic in my humble opinion if all things remain constant and nothing occurs to shake things up downside as stated over the last several weeks. At this point it won’t take much as stated above! I state with caution as seen in the charts below we are at a technical momentum decision time as we have been week after week based on my strategy that puts price action in a stall at these levels. I will be ready to alert of the change in trend or continued movement upside through social media and daily outlook.
For the Indices ETF or long term holder, different rules may apply as quarterly re-balancing is my preference for managing such markets. Option to move trailing stops to key MML, Fibonacci or moving average levels can lock in more profit if and when a pullback may occur.
Note that you can also view my market outlook for ES, YM, and NQ on YouTube.
Attempting to determine which way a market will go on any given day is merely a guess in which some will get it right and some will get it wrong. Being prepared in either direction intraday for the strongest probable trend is by plotting your longer term charts and utilizing an indicator of choice on the lower time frame to identify the setup and remaining in the trade that much longer. Any chart posted here is merely a snapshot of current technical momentum and not indicative of where price may lead forward.
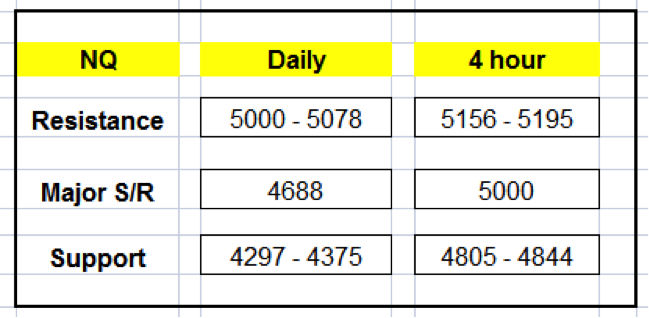
NQ – Nasdaq Futures
Technical Momentum: UPTREND
Using the Murray Math Level (MML) charts on higher time frames can be a useful market internal tool as price action moves amongst fractal levels from hourly to daily charts. Confluence of levels may be levels of support/resistance or opportunities for a breakout move.
CHARTS: Daily; 4 hour
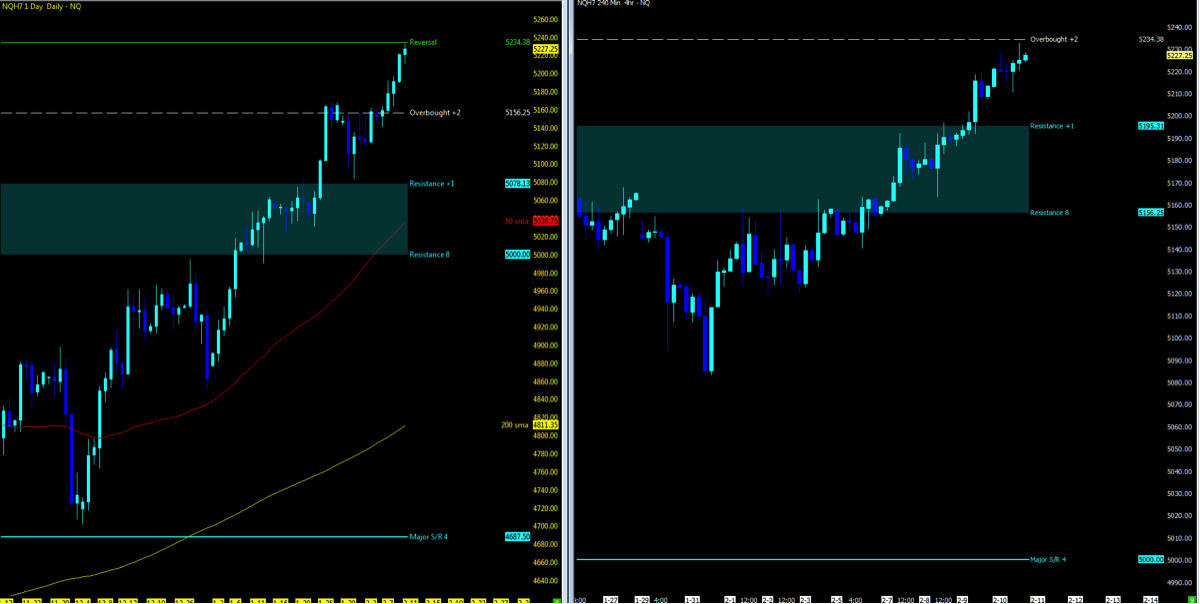
MML Levels (NQ)
5234: Daily Reversal; 4 Hour “Overbought”
Nearest Open Daily Gap: 5121.25
Lowest Open Gap: 4017
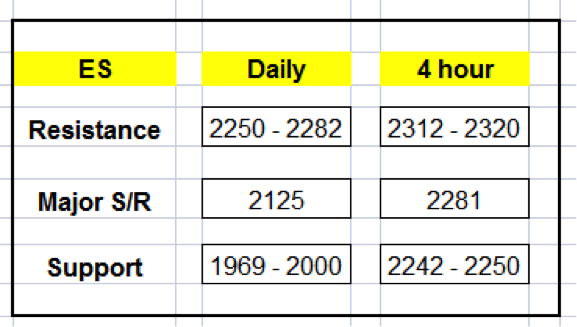
ES – S&P Futures
Technical Momentum: UPTREND
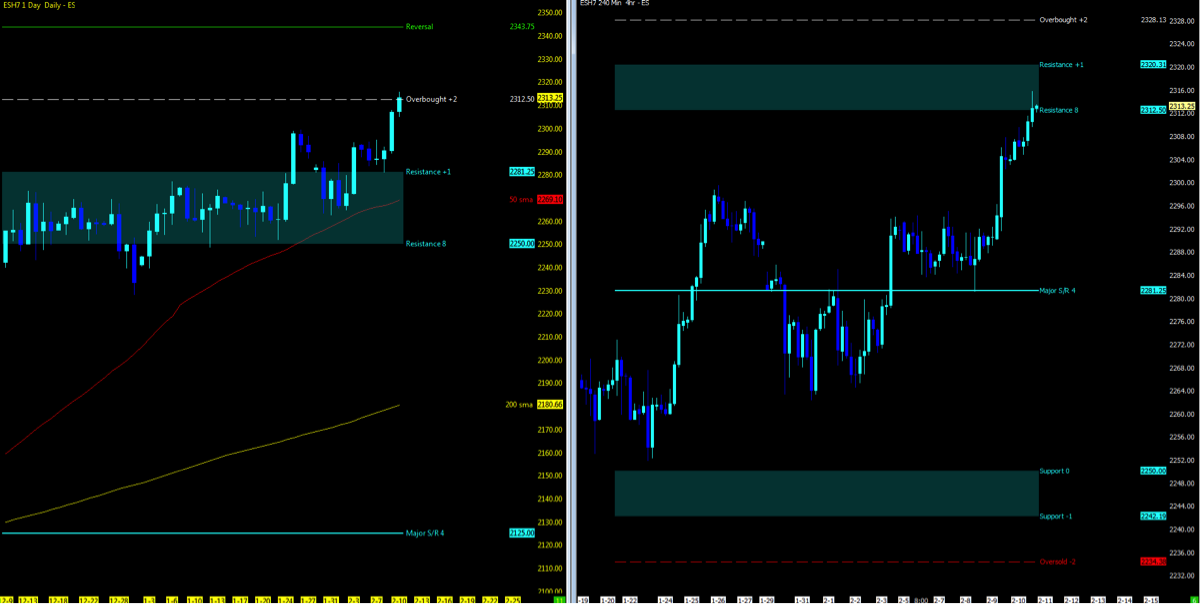
MML Levels (ES)
2312: Daily “Overbought”; 4 hr Resistance
Nearest Open Daily Gap: 2292
Lowest Open Gap: 1860.75
Thanks for reading and remember to always use a stop at/around key technical trend levels.
Twitter: @TradingFibz
The author trades futures intraday and may have a position in the mentioned securities at the time of publication. Any opinions expressed herein are solely those of the author, and do not in any way represent the views or opinions of any other person or entity.


: Showing Some Signs of Emerging Strength")
