THE BIG PICTURE
Consolidation on Dow Jones futures (YM) and S&P 500 futures (ES) seems to be the trend of 2017 as Nasdaq futures (NQ) steams ahead and leaves the indices in its dust trail. Week two, day four (1.12.17) seemed to be the hope of some correction in the market, only to quickly recover intraday. Seems to be the common thread of the market these days. It was my hope in week two the YM would retest the 20K, ring the bell and whatever came next leave it to the big crumbs. Note I said “hope,” not will.
So what appears to be evident at this point and what may the market be waiting for? Is the S&P 500 (INDEXSP:.INX) ready for new highs? Will the Nasdaq (INDEXNASDAQ:.IXIC) keep making higher highs? Let’s explore.
Fact #1 is that on the post pre-POTUS win for Trump, markets rallied higher. We continue to hold at those highs. The factoid that whatever pullback is occurring is only being bought back up continuing the momentum upside. This is lending to the appearance that this market is just not ready or in a position for any significant pullback. However we all know it doesn’t take much for a market to turn at any given moment. A tweet by Trump, a word out of Yellen that will turn the ALGO machines on overdrive.
With multiple fed speakers in the week ahead, including Yellen, POTUS inauguration with subsequent first days of office and FANG stocks earnings season upon us may be the catalyst we need to push in either direction.
As previously stated, in any time in the past when indices to continue to push at the highs, there will be an evident of two sides in the market. Those that side with “when at the highs we go higher” and those that persistently are pessimistic and think the market should just crash. While I seek the short side as well, any good pullback is always signs of a healthy market, at some point, prices recover and make higher highs.
Technical momentum probability at this point leads us higher on the bigger pic in my humble opinion if all things remain constant and nothing occurs to shake things up downside. Then again you can tune in to the perma-bears and miss the continued run up in the market and sit out the gains since election results and when the market does correct itself, “they” will tell you they told you so. Meanwhile you missed out because you let your bias in the way of where the markets should be and where it actually is.
Note that you can also view my market outlook for ES, YM, and NQ on YouTube.
Attempting to determine which way a market will go on any given day is merely a guess in which some will get it right and some will get it wrong. Being prepared in either direction intraday for the strongest probable trend is by plotting your longer term charts and utilizing an indicator of choice on the lower time frame to identify the setup and remaining in the trade that much longer. Any chart posted here is merely a snapshot of current technical momentum and not indicative of where price may lead forward.
NQ – Nasdaq Futures
Technical Momentum: UPTREND
Using the Murray Math Level (MML) charts on higher time frames can be a useful market internal tool as price action moves amongst fractal levels from hourly to daily charts. Confluence of levels may be levels of support/resistance or opportunities for a breakout move.
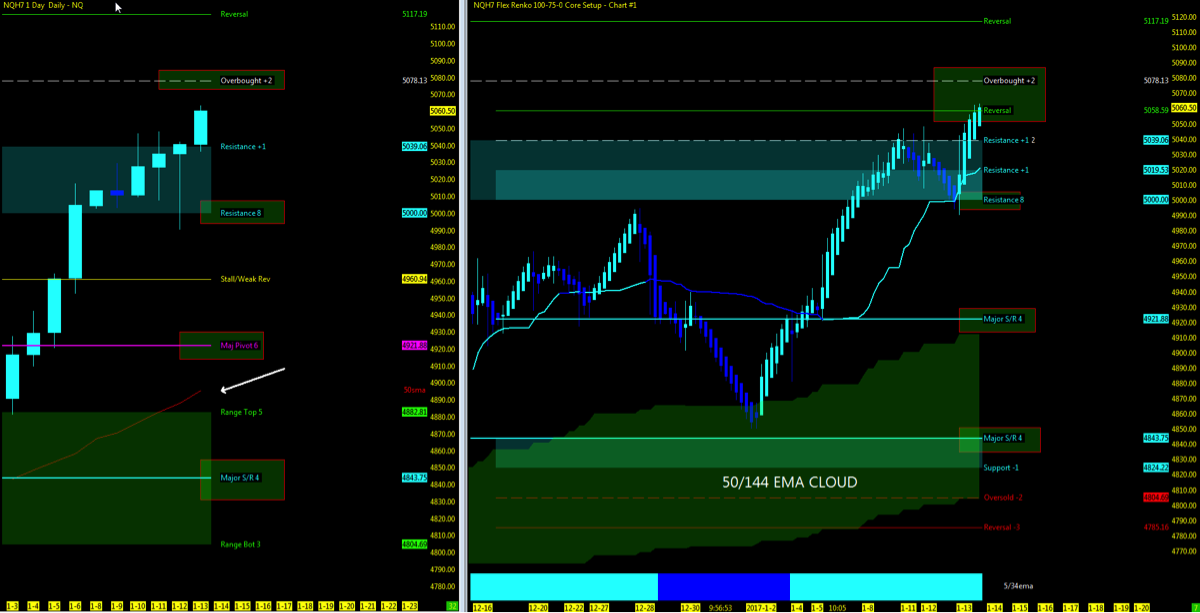
Levels to Watch
- Upside: 5078 if we hold above 5039
- Downside: 5000 (50ma below)
- Major S/R: 4844 (50ma above)
MML Levels (NQ)
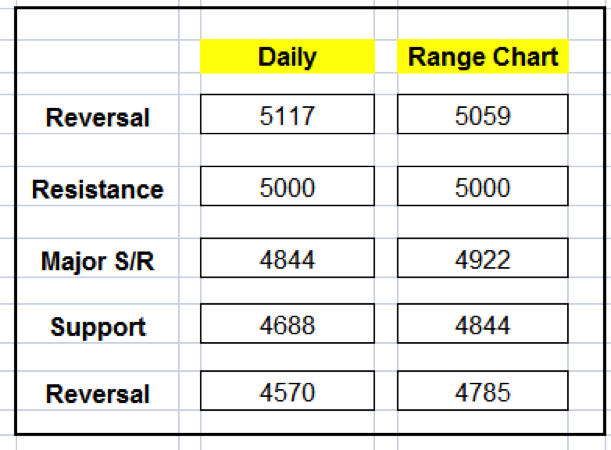
Nearest Open Daily Gap: 4610.75
Lowest Open Gap: 4017
ES – S&P Futures
Technical Momentum: UPTREND
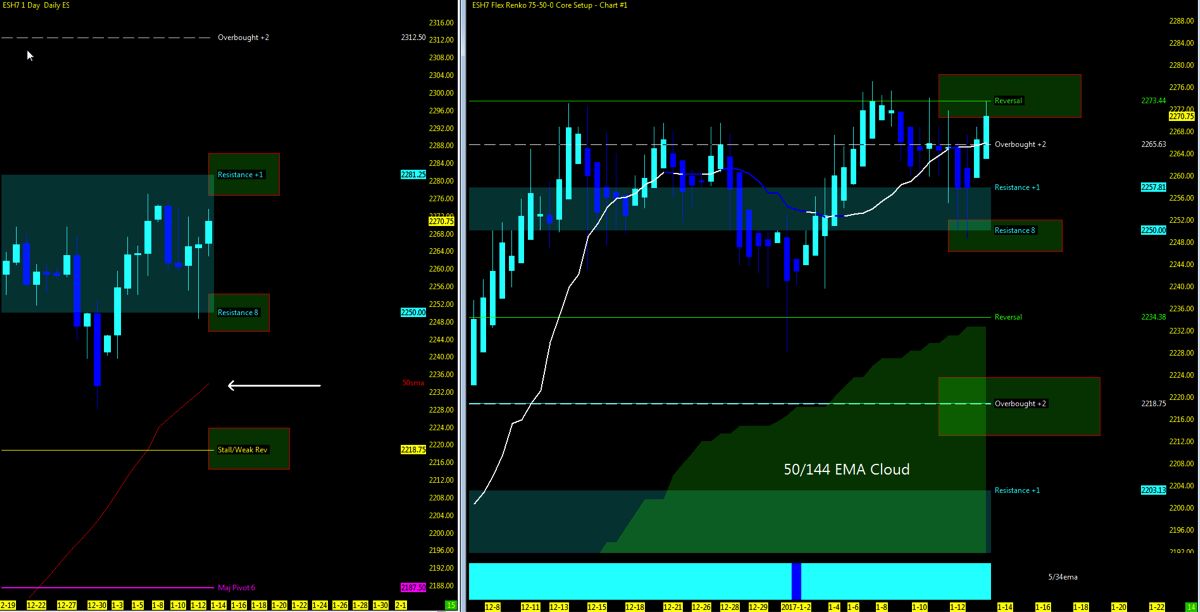
Levels to Watch
- Upside: 2281 (watch 2273 resistance)
- Downside: 2250 (50ma below) if we break 2250
- Major S/R: 2125 (200ma above)
MML Levels (ES)
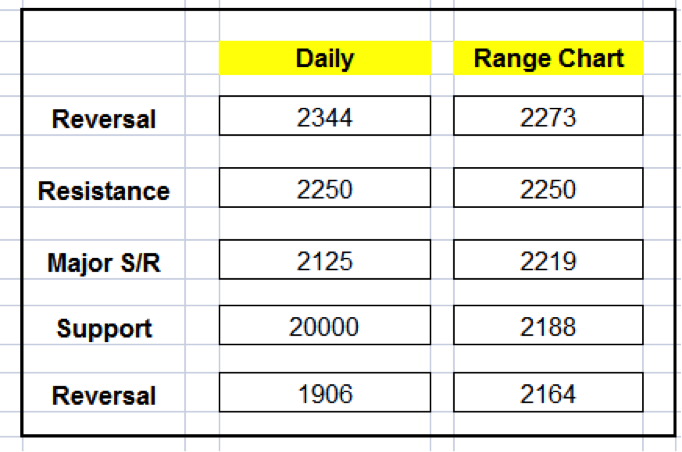
Nearest Open Daily Gap: 2197.25
Lowest Open Gap: 1860.75
Thanks for reading and remember to always use a stop at/around key technical trend levels.
Twitter: @TradingFibz
The author trades futures intraday and may have a position in the mentioned securities at the time of publication. Any opinions expressed herein are solely those of the author, and do not in any way represent the views or opinions of any other person or entity.

: Showing Some Signs of Emerging Strength")

