S&P 500 Futures Trading Considerations For June 23, 2017
The battle lines are drawn on the S&P 500 (INDEXSP:.INX) and traders are competing for power across these price lines (support/resistance). We’re pretty much landlocked until either buyers or sellers win out.
Check out today’s economic calendar with a full rundown of releases. And note that the charts below are from our premium service and shared exclusively with See It Market readers.
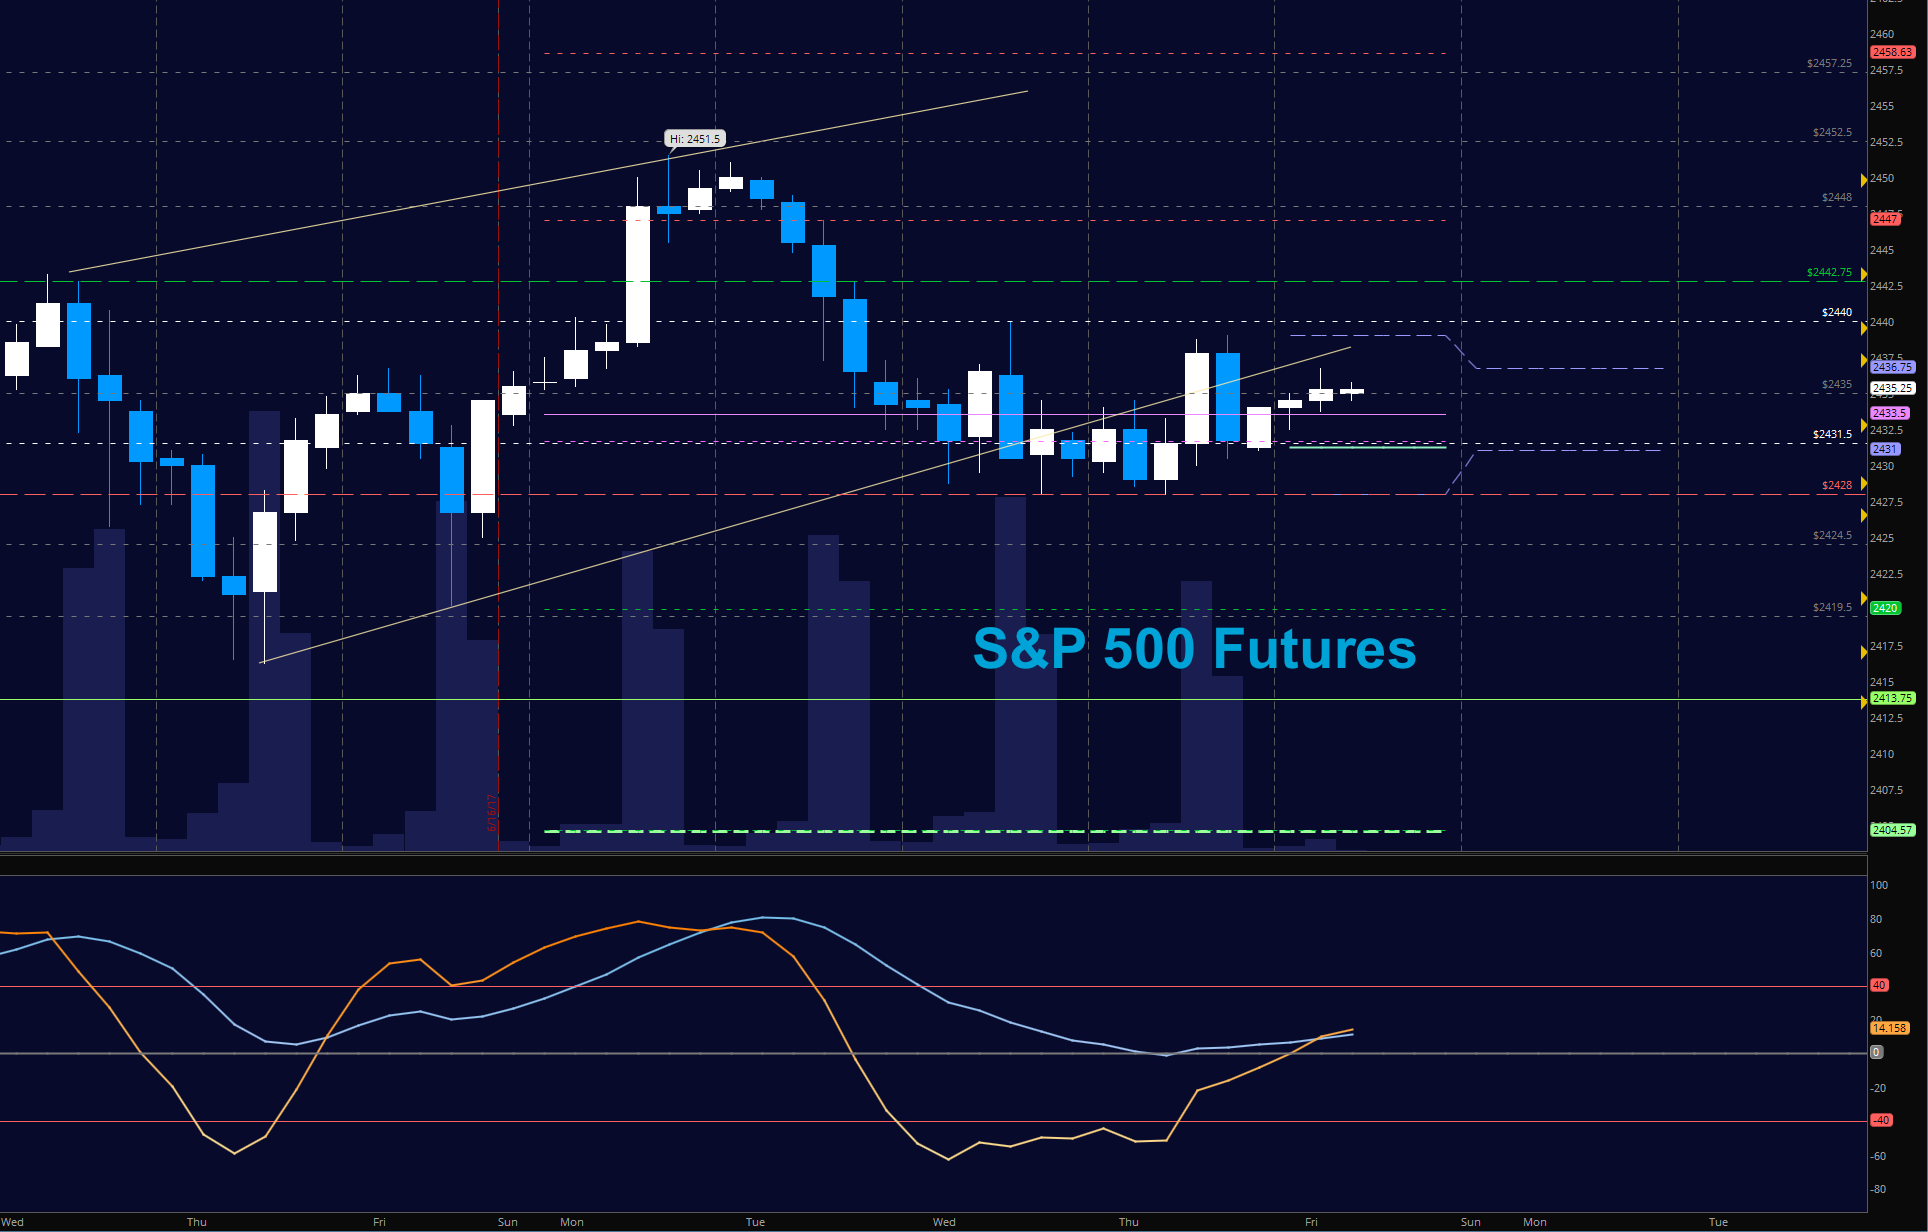
S&P 500 Futures (ES)
With generally sideways momentum, our pullbacks will see buyers but sellers are definitely present, delivering a lower high. Support intraday has shifted down to 2428 but could break before recovering as we hold range bound intraday formations for now. The bullets below represent the likely shift of trading momentum at the positive or failed retests at the levels noted.
- Buying pressure intraday will likely strengthen above a positive retest of 2440
- Selling pressure intraday will likely strengthen with a failed retest of 2428
- Resistance sits near 2440.5 to 2446.5, with 2451.5 and 2454.5 above that.
- Support holds between 2428 and 2424.25, with 2419.5 and 2413.5 below that.
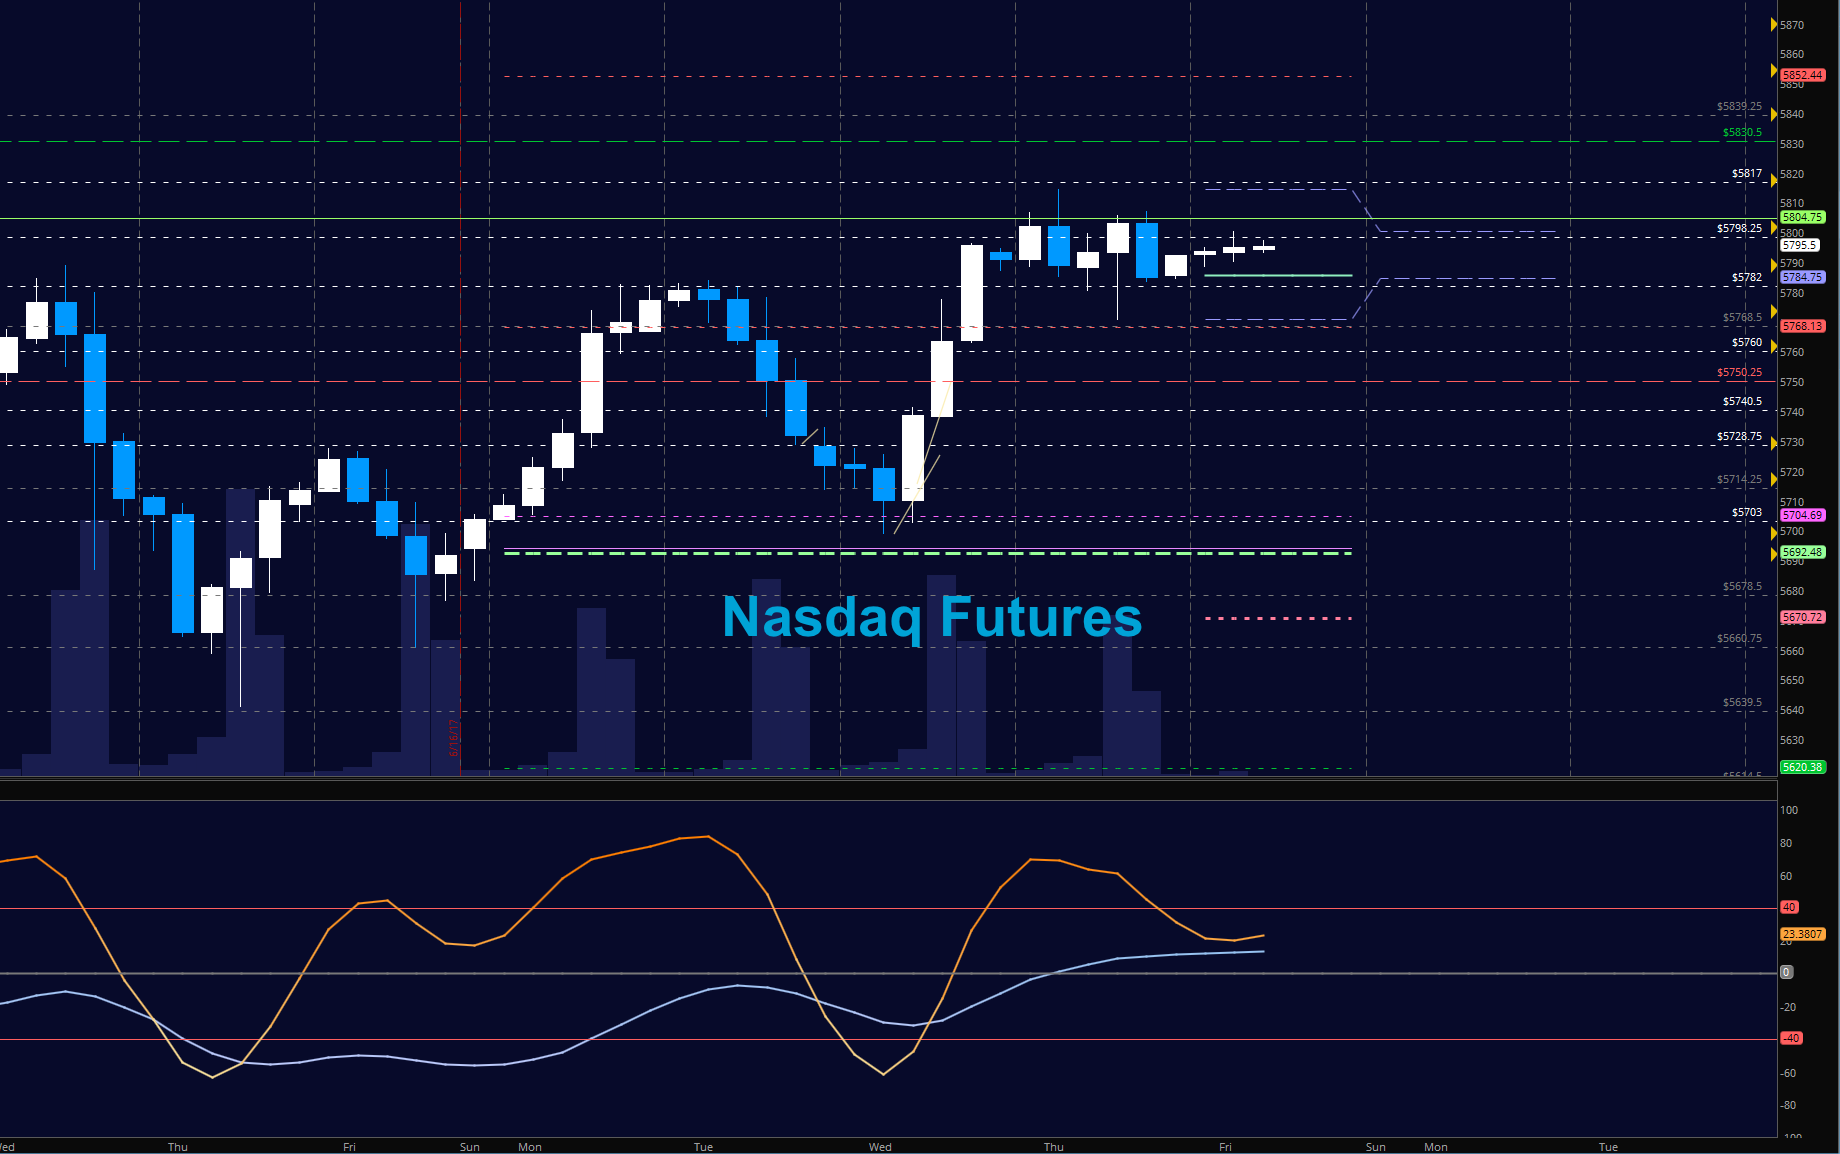
NASDAQ Futures (NQ)
Tech continues to struggle in a rangebound formation. Momentum holds sideways but we are aggressively testing support near 5780. We see new resistance at 5815.5, and then again at 5830.5. Traders are likely to attempt recovery once again with a test of deeper support, but the failure to hold 5774 will make continuation upward quite difficult. The bullets below represent the likely shift of intraday trading momentum at the positive or failed tests at the levels noted.
- Buying pressure intraday will likely strengthen with a positive retest of 5805
- Selling pressure intraday will likely strengthen with a failed retest of 5770.25
- Resistance sits near 5789.75 to 5800.25, with 5805.5 and 5825.5 above that.
- Support holds between 5766.25 and 5750.5, with 5736.25 and 5704.75 below that.
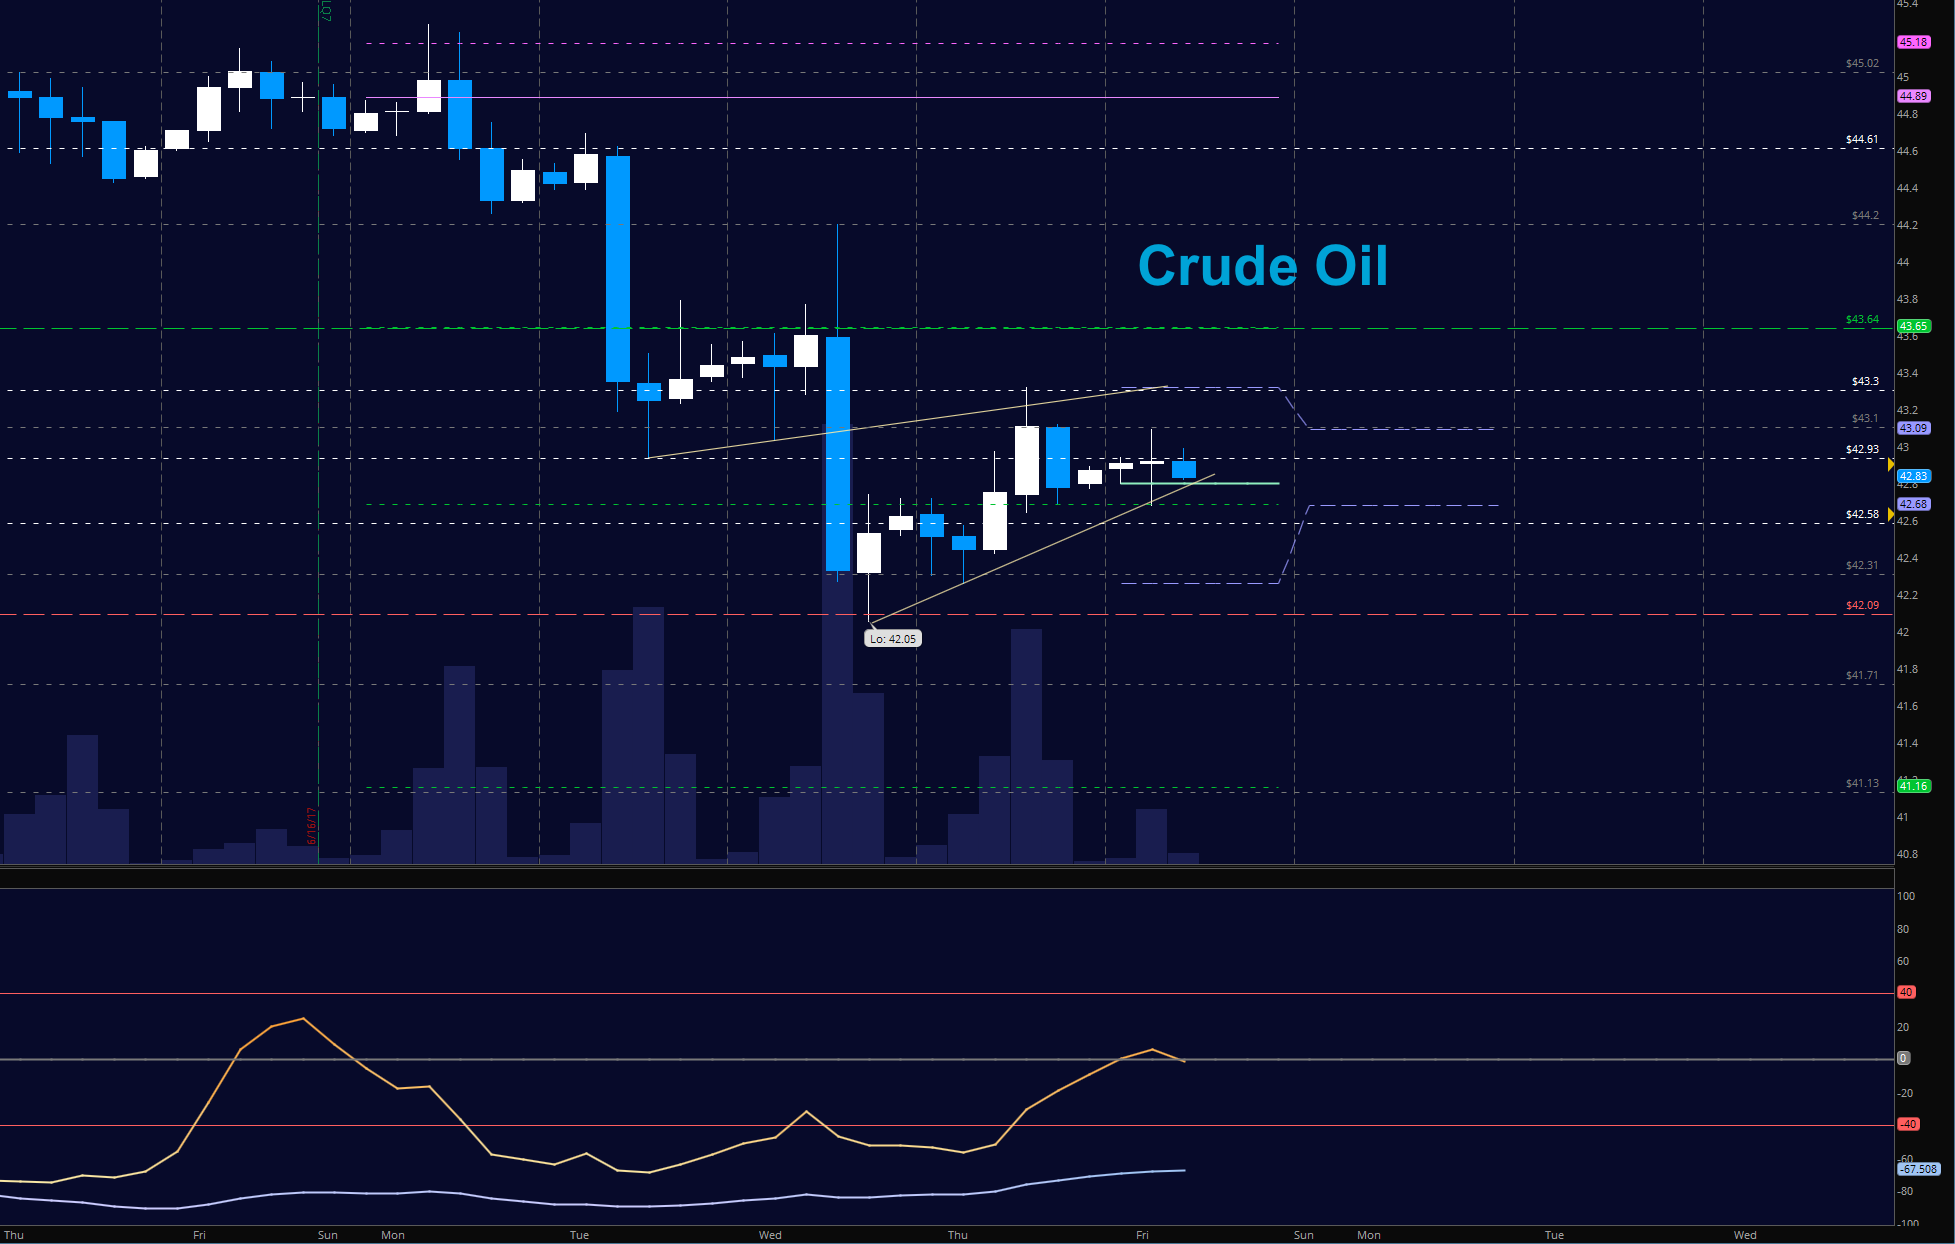
WTI Crude Oil
The range above near 42.9 and 43.3 remains resistance. A bounce to higher levels is not out of the question but the recovery will only be marked by a retest of higher lows, or lower lows with divergent action. Fibonacci targets remain between 41.7 and 41.2. The bullets below represent the likely shift of trading momentum at the positive or failed tests at the levels noted.
- Buying pressure intraday will likely strengthen with a positive retest of 42.97
- Selling pressure intraday will strengthen with a failed retest of 42.3
- Resistance sits near 43.3 to 43.7, with 44.2 and 44.89 above that.
- Support holds between 42.23 to 42.05, with 41.71 and 41.13 below that.
If you’re interested in watching these trades go live, join us in the live trading room from 9am to 11:30am each trading day. Visit TheTradingBook for more information.
If you’re interested in the live trading room, it is now primarily stock market futures content, though we do track heavily traded stocks and their likely daily trajectories as well – we begin at 9am with a morning report and likely chart movements along with trade setups for the day.
As long as the trader keeps himself aware of support and resistance levels, risk can be very adequately managed to play in either direction as bottom picking remains a behavior pattern that is developing with value buyers and speculative traders.
Twitter: @AnneMarieTrades
The author trades stock market futures every day and may have a position in mentioned securities at the time of publication. Any opinions expressed herein are solely those of the author, and do not in any way represent the views or opinions of any other person or entity.


