S&P 500 (INDEXSP:.INX) Overview & Outlook – August 29, 2017
Stock market futures immediately pushed lower after North Korea fired a missile over Japan. This situation has traders on guard… but one way to be sure you manage risk is to focus on price and know where and how to use support and resistance. Key futures trading levels for the S&P 500, Nasdaq, and crude oil are below.
Check out today’s economic calendar with a full rundown of releases. And note that the charts below are from our premium service and shared exclusively with See It Market readers.
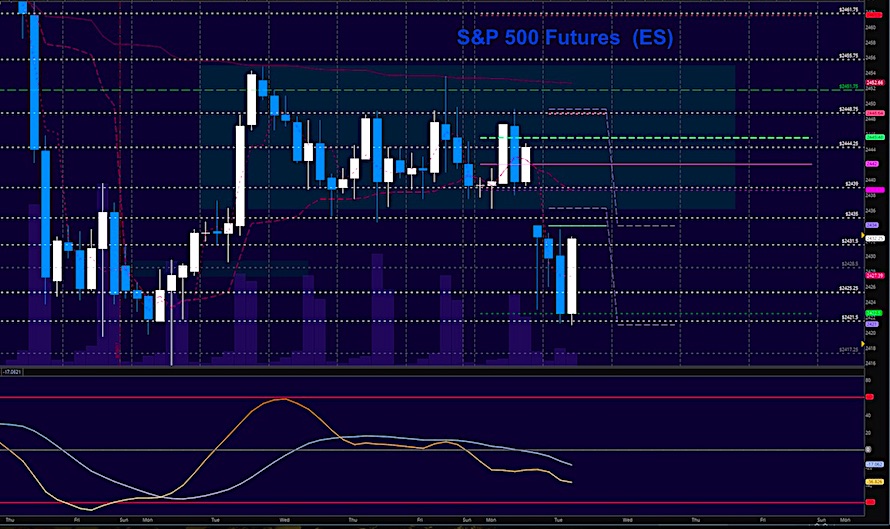
S&P 500 Futures (ES)
A gap down and a retest of deeper support is holding for now but bearish pressure continues to show. The failure to crest above 2435 will be decidedly bearish for now. The bullets below represent the likely shift of trading momentum at the positive or failed retests at the levels noted. The bullets below represent the likely shift of intraday trading momentum at the positive or failed tests at the levels noted.
- Buying pressure intraday will likely strengthen above a positive retest of 2435
- Selling pressure intraday will likely strengthen with a failed retest of 2421
- Resistance sits near 2439 to 2445.25, with 2449.75 and 2451.5 above that.
- Support holds between 2425.25 and 2421, with 2417.5 and 2412.5 below that.
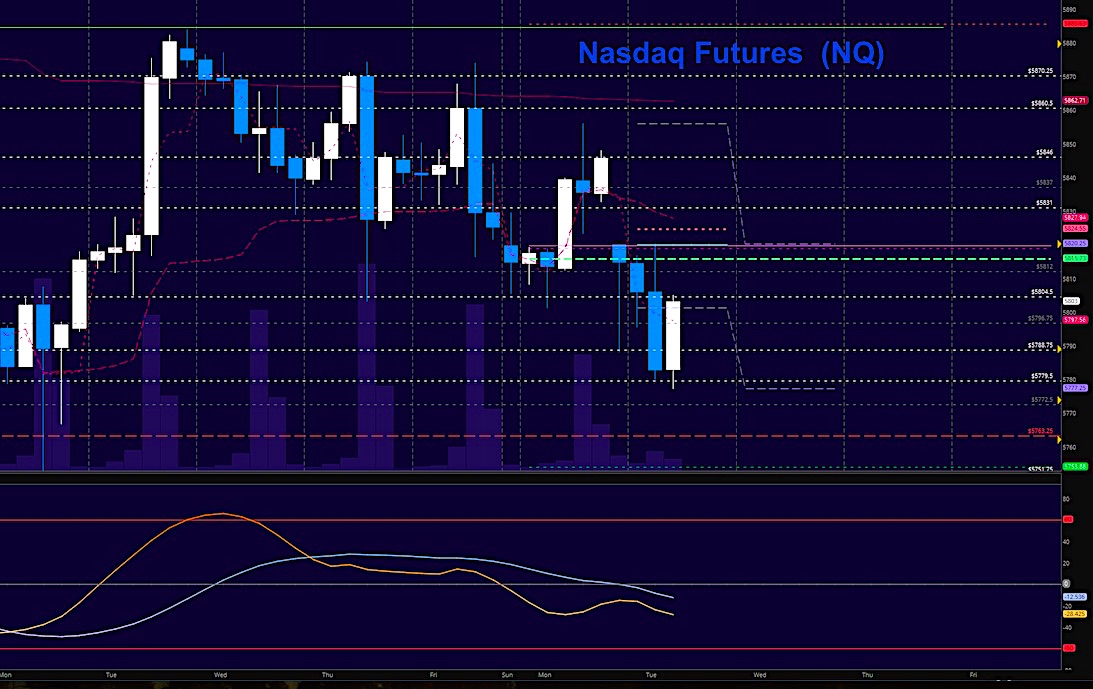
NASDAQ Futures (NQ)
Sellers have forced the chart into deep support seen over the last two weeks for the third time as lows hold. The gaps down is in danger of continuing if we fail to recover 5820. Momentum intraday is slightly bearish. The bullets below represent the likely shift of intraday trading momentum at the positive or failed tests at the levels noted.
- Buying pressure intraday will likely strengthen with a positive retest of 5821.75
- Selling pressure intraday will likely strengthen with a failed retest of 5777
- Resistance sits near 5819.75 to 5827.25, with 5846.75 and 5860.5 above that.
- Support holds between 5784.5 and 5778.5, with 5768.75 and 5753.5 below that.
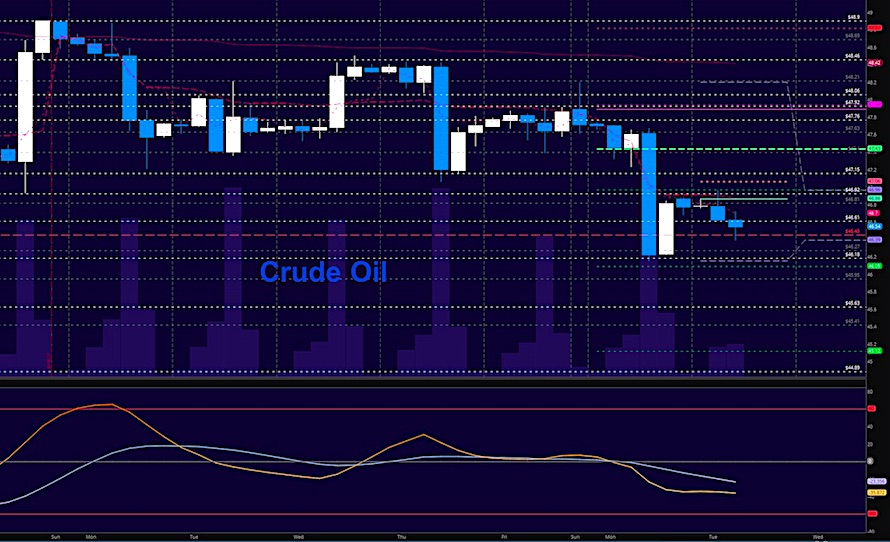
WTI Crude Oil
Into the API report, charts are holding lower levels and seem to be on the path to test lows seen in July. Deep support continues to be bought. Momentum is slightly bearish. The bullets below represent the likely shift of trading momentum at the positive or failed tests at the levels noted.
- Buying pressure intraday will likely strengthen with a positive retest of 47.07
- Selling pressure intraday will strengthen with a failed retest of 46.2
- Resistance sits near 47.04 to 47.44, with 47.74 and 48.06 above that.
- Support holds between 46.4 to 46.09, with 45.84 and 45.41 below that.
If you’re interested in the live trading room, it is now primarily stock market futures content, though we do track heavily traded stocks and their likely daily trajectories as well – we begin at 9am with a morning report and likely chart movements along with trade setups for the day.
As long as the trader keeps himself aware of support and resistance levels, risk can be very adequately managed to play in either direction as bottom picking remains a behavior pattern that is developing with value buyers and speculative traders.
Twitter: @AnneMarieTrades
The author trades stock market futures every day and may have a position in mentioned securities at the time of publication. Any opinions expressed herein are solely those of the author, and do not in any way represent the views or opinions of any other person or entity.


