Stock Market Futures July 8 – Market Outlook – It’s the jobs report day. On S&P 500 futures, there is a battle for control afoot as sellers continue to show up at breakout levels to force buyers back into congestion. Support levels overnight near 2088 were briefly broken, and then recovered in the early morning. As well, yesterday’s support level of 2081 was nearly tested after hours, but recovered sharply. So the bulls still hold control.
Motion is jagged, as evidence rises of a jittery group of traders. The weight of momentum remains long, and pullbacks should find buyers. Momentum continues to hold positive and at the current level of 2093, quite near this point at this time yesterday. Buyers fight to hold support, but overhead supply and sellers have kept them from breaking out of the congestion. Breaches over 2098 should fuel a run into 2104.75 (see more levels below).
See today’s economic calendar with a rundown of releases.
RANGE OF TODAY’S MOTION
E-mini S&P Futures

Stock market futures July 8 (S&P 500 futures outlook – ES_F) –
Upside trades on S&P 500 futures – Favorable setups sit on the positive retest of 2094.5, or a positive retest of the bounce off 2089.5 with positive momentum. Be very careful watching for sellers showing up near 2091.75, as rejection of price there off the 2089.5 bounce entry could signal that sellers are collecting strength. I use the 30min to 1hr chart for the breach and retest mechanic. Targets from 2089.5 are, 2091.5, 2094.5, 2097.25, 2099.75, 2102.5, and if we expand again, we could stretch to 2104.5, 2107.75, and perhaps 2112.5.
Downside trades on S&P 5oo futures – Favorable setups sit below the failed retest of 2088 or at the failed retest of 2091.5 with negative divergence. It is important to watch for higher lows to develop with the 2091.5 entry, as the chart may be attempting a retest of the recent high under the current bullish environment. Retracement into lower levels from 2091.5 gives us the targets 2088.5, 2084.75, 2081.75, 2078.75, 2074.75, 2072.5, 2070.25, 2067.75, 2064.25, 2061.5, and 2054.75, if sellers take over.
Nasdaq Futures
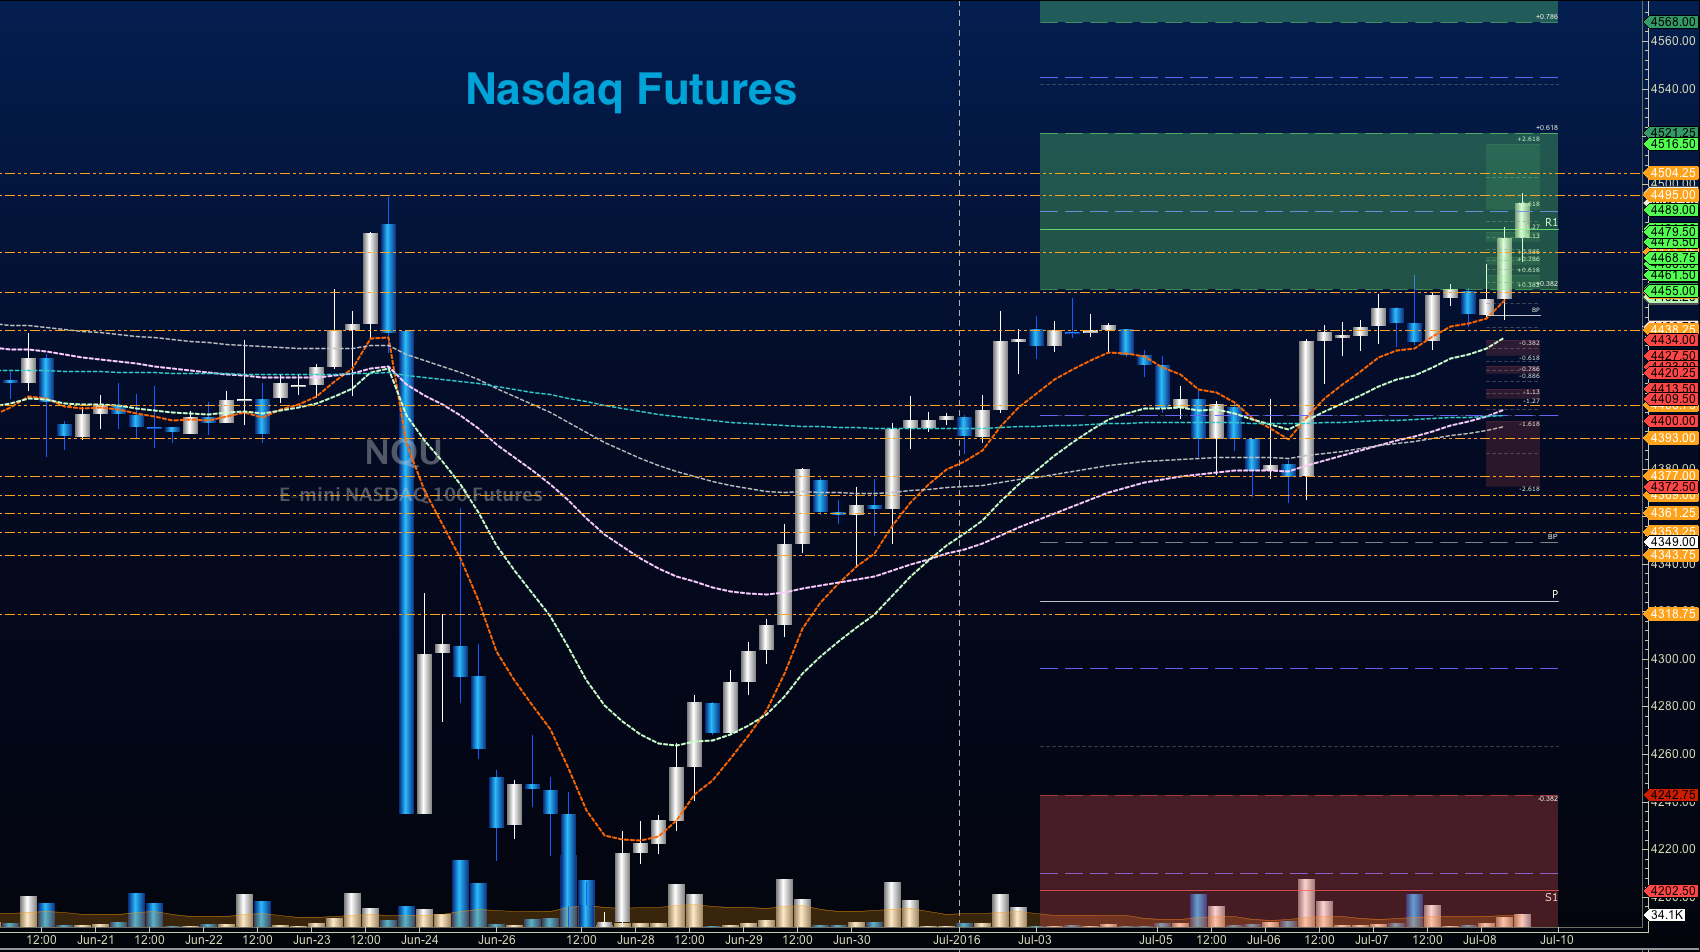
Stock market futures July 8 (Nasdaq futures outlook – NQ_F) –Congested levels of resistance sit near the 4455 region. Support levels to watch are 4440.5, and a lower 4432. Resistance sits in a wide choppy space between 4455 and 4479.25.
Upside trades on Nasdaq futures – Favorable setups sit on the positive retest of 4451.75, or a positive retest of 4442.5 with positive momentum. I use the 30min to 1hr chart for the breach and retest mechanic. Watch for the lower high to develop near 4444-4448, if sellers exercise more power intraday. Targets from 4448.5, 4454, 4457.25, 4461.25, 4466.25, and 4469.25, to 4476.75, if buyers overpower the line of sellers in the way.
Downside trades on Nasdaq futures – Favorable setups sit below the failed retest of 4450.75 or at the failed retest of 4448.5 with negative divergence. Retracement into lower levels from 4448.5 gives us the targets 4444, 4441.75, 4437.25, 4433.5, 4427.5, 4421.75, 4416.5, 4409.75, 4403.5, 4398, 4395.5, 4391.5, 4389.5, 4386.25, 4384, 4378.25, 4373.5, 4368.75, 4364.75, 4358.5 and 4348.25, if sellers resume control.
Crude Oil
Crude Oil trading outlook July 8, 2016 (CL_F) –
The EIA report showed a lower draw than the API report, and the selling began. That important level of 48 can’t be understated to me. Below this level, sellers have been quite aggressive, and the loss of 47.7 seemed to assist in the acceleration of selling.
The trading range on crude oil today appear to be 44.04 to 46.64 – remembering that in volatile spaces like these, edges can easily be broken. The chart is extremely congested this morning, and it appears that traders here are waiting on the jobs number also.
Upside trades on crude oil can be staged on the positive retest of 45.77, or at a bounce off 45.2 with positive momentum. I often use the 30min to 1hr chart for the breach and retest mechanic. Targets from 45.2 are 45.42, 45.59, 45.73, 46.02, 46.34, 46.6, 46.9, 47.04, 47.32, 47.56, 47.74, and 48.14; if traders try once again to recapture 48.
Downside trades on crude oil can be staged on the failed retest of 45.1, or at the failed retest of 46.12 with negative divergence. Targets from 46.12 are 45.79, 45.48, 45.2, 44.9, 44.67, 44.34, 44.02, 43.84, and 43.65, if selling really takes hold.
Visit TheTradingBook.com for more information.
If you’re interested in the live trading room, it is now primarily futures content, though we do track heavily traded stocks and their likely daily trajectories as well – we begin at 9am with a morning report and likely chart movements along with trade setups for the day.
As long as the trader keeps himself aware of support and resistance levels, risk can be very adequately managed to play in either direction as bottom picking remains a behavior pattern that is developing with value buyers and speculative traders.


 Trading Into Inflection Point")