Outlook for Friday, Feb 19 – Downward price action and mixed momentum open our morning here across the major stock market futures indices. Looking at the S&P 500 futures chart, it’s clear that congestion below at 1904.75 marks current support.
Stock market futures charts show signs that buyers are sitting here ready to defend lower support zones but the intraday trend is holding lots of negative momentum.
We are in a clear decision zone with important S&P 500 futures support levels of 1900.5, 1897, and 1894; and resistance levels sit at 1922.75, 1927.5, 1931.75, and 1934.5. This is a low probability trading area for follow through as signals are mixed across time frames. A coin toss here – and I don’t trade the coin toss so I’ll be looking for signal resolution.
Momentum on the four hour chart is negative, but holding in positive trending territory – suggesting drifts into support. Daily charts read momentum as positive but in negative trending territory – suggesting bounces into resistance. Moving averages sit on both sides of the buy/sell line – hence the noisy patterns present here.
Shorter time frame momentum indicators are sitting in positive territory and trending downward but positive divergence is taking hold in longer time frames for now.
See today’s economic calendar with a rundown of releases.
THE RANGE OF TUESDAY’S MOTION
Crude Oil Futures (CL_F)
Outlook for Friday, Feb 19 – Crude oil futures reversed sharply and now sits at 32.2 – a support level of note. Momentum and trend show further downside possible but I am looking for the failed bounce to re-initiate short action.
Today, the trading ranges for crude oil are between 32.2 and 33.
Composite charts are still somewhat messy right at the contract roll – Moving averages in crude oil are mixed across longer intraday time frames across the board. Four hour time frames show positive sloping to flat moving averages with negative divergence in positive trending territory underneath (yes, very messy).
Intraday long trading setups suggest a long off 32.24 bounce or 33.1 breach into 33.4, 33.6, 34.07, and if buyers hold on, we could see crude oil futures rise to as high as 34.4 to 34.7.
Intraday short trading setups suggest a short below a 33.03 failed retest or a failed retest of 32.7 with negative divergence showing sends us to 32.4, 32.02, 31.84 and 31.54.
Have a look at the fibonacci levels marked in the blog for more price targets.
E-mini S&P 500 Futures (ES_F)
Below is a S&P 500 futures chart with price support and resistance trading levels for today. Click to enlarge.
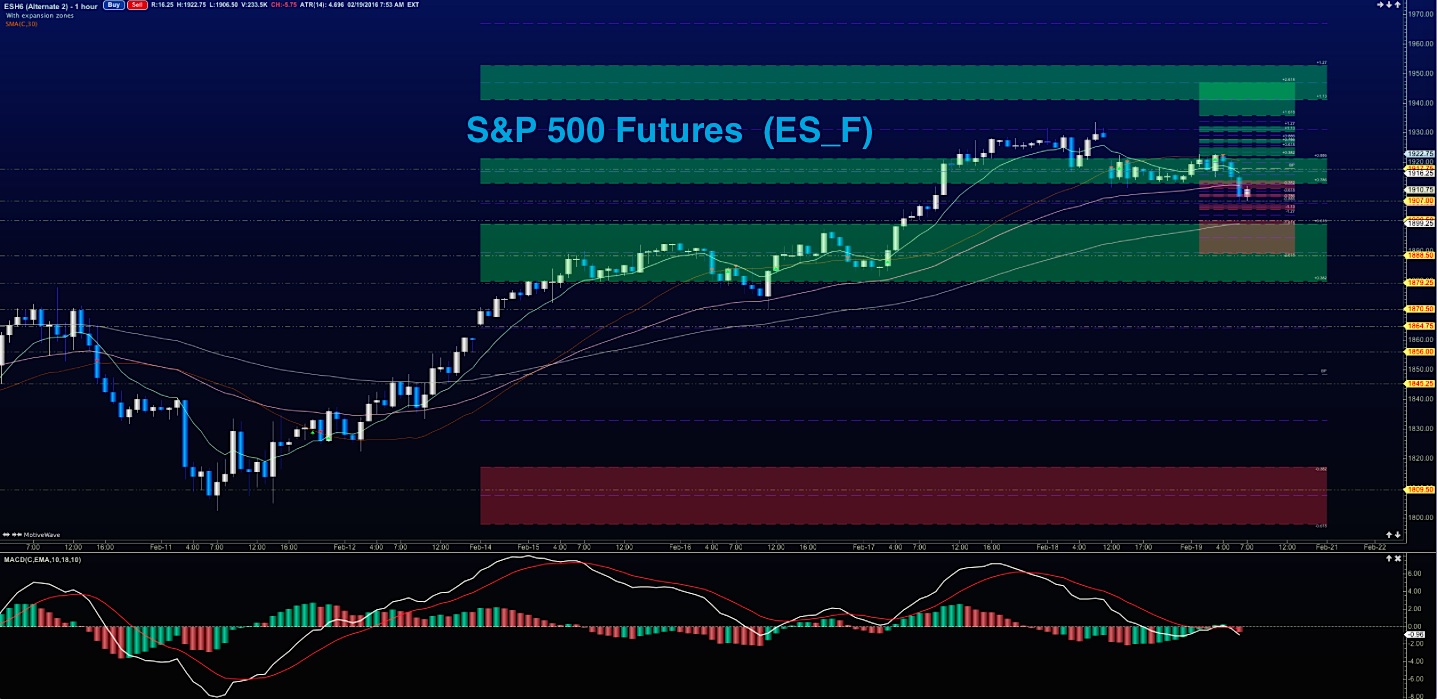
Outlook for Friday, Feb 19 – S&P 500 futures established new support at 1904-1907. Congestion currently sits at 1914-1917. The level to breach today will be 1919. If S&P 500 futures can trade over 1919, the price action should hold and move into higher resistance levels.
Upside motion has the best setup on the positive retest of 1908 (watch momentum here; it may have trouble near 1914)- or a retest after expansion above 1919. Targets from 1919 are 1923, 1927.5, 1931.5, 1934.25, 1937.75, 1941.5 and if we can catch a bid there, we could expand into 1946.5 to 1950. Big resistance test sits at the region between 1946-1951.
Watch the higher lows to help you stay on the right side of the long trade. S&P 500 futures charts look quite weak here but the undercurrent long needs to be considered.
Downside motion opens below the failed retest of 1914 or at the failed retest of 1923 with negative divergence. Retracement into lower levels from 1923 gives us the targets 1921.5, 1917.75, 1916, 1912.25 and perhaps 1904.75. If buyers do not provide support there, we’ll see the familiar 1897 – 1894 levels once more.
Have a look at the fibonacci levels marked in the blog for more price targets.
If you’re interested in the live trading room, it is now primarily stock market futures content, though we do track heavily traded stocks and their likely daily trajectories as well – we begin at 9am with a morning report and likely chart movements along with trade setups for the day.
As long as traders remain aware of support and resistance levels, risk can be very adequately managed to play in either direction as bottom picking remains a behavior pattern that is developing with value buyers and speculative traders.
Twitter: @AnneMarieTrades
The author trades stock market futures every day and may have a position in mentioned securities at the time of publication. Any opinions expressed herein are solely those of the author, and do not in any way represent the views or opinions of any other person or entity.

 Rolling Over At Key Fibonacci Level?")


