The stock market “santa rally” typically doesn’t begin until just before Christmas.
But that doesn’t stop investors from expecting the rally early.
First week of December: No Santa
Second week of December: No Santa
Third week of December: No Santa
Santa didn’t come when we wanted him to… and he didn’t come when he was supposed to. This appears to be the year that santa went missing –> perhaps he drank too much spiked holly nog and crashed his sleigh.
In any event, it’s been a literal December Disaster for investors.
For the month, the S&P 500 Index is down -12.45%. The Nasdaq Composite is down -13.6% and the Russell 2000 is down -15.7%.
That’s just downright nasty. Especially as people come together to celebrate the holiday and new year.
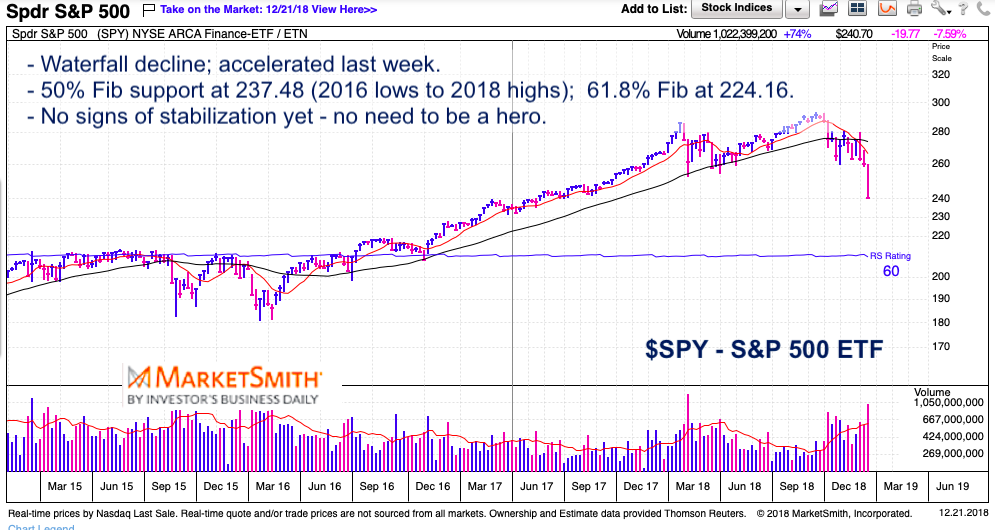
S&P 500 “Weekly” Chart w/ Fibonacci downside supports
Note that the following MarketSmith charts are built with Investors Business Daily’s charting suite. I am an Investors Business Daily (IBD) partner and promote the use of their products. The entire platform offers a good mix of technical and fundamental data.
It’s impossible to speak with any confidence about trading targets in the middle of a meltdown. And, to be clear, we closed on the lows Friday so there are NO signs of stabilization yet.
With this in mind, it’s wise to zoom out and highlight some price levels of importance. Stocks are on clearance sale right now, but prices will continue to lower until all stocks are sold (and demand returns). Tread lightly – it’s best to wait for some stabilization.
For the coming week, investors should eye $237 on the S&P 500 ETF (NYSEARCA: SPY) and 2375 on the S&P 500 Index. These levels mark the 50% Fibonacci retracement of the stock market rally from the 2016 lows to 2018 highs. Breaching that level might put the 61.8% Fibonacci level in play ($224 on SPY and 2240 on the Index).
Those are broad markers to watch. The market is not a safe place right now, so it’s best to make a list and have a plan (accumulate stocks/indexes you like in small bite size increments – if longer-term… stay patient and small if short-term).
On shorter time frames, the S&P 500 is bar 6 of a daily Demark 9 buy setup. That could bring a “trading low” / bounce by Wednesday or Thursday of next week.
Twitter: @andrewnyquist
The author has a long position in mentioned securities at the time of publication. Any opinions expressed herein are solely those of the author, and do not in any way represent the views or opinions of any other person or entity.
December 22, 2018 (3:20 pm CST) This article was updated to include a sentence on the short-term outlook / analysis.


 Rolling Over At Key Fibonacci Level?")

")