
After a brief visit to lower prices, everyone (almost everyone) in our important family of stock market ETFs, the Economic Modern Family, gained in price this past week.
We give honorable mention to the Russell 2000 Index ETF NYSEARCA: IWM – our granddad.
Not only did the Russell 2000 (IWM) show bullish muscle before the other three indices did, it also had the best percentage gain.
Partially because of a rising consumer sentiment and a declining unemployment rate, Gramps got happy.
As a result, the Retail Sector ETF NYSEARCA: XRT – Granny- gained as well. More importantly, she held the major moving averages.
The comes our Big Brother, the Biotechnology Sector ETF NYSEARCA: IBB has been on a “high” since the week of October 25.
However, a couple of the “kids” rallied into price resistance.
As well, one sector closed down for the week, and it was an important sector at that. Let’s review…
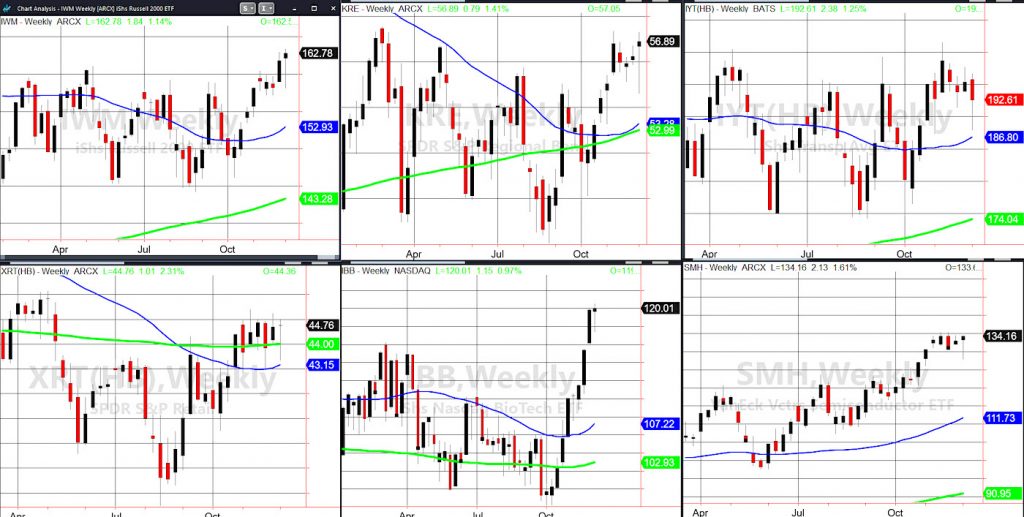
IWM, (top left) looks intent on trying to reach its all-time high made in 2018 at 173.39. That’s both good news and bad news.
The good news is that at this rate, IWM might get there.
The bad news is that IWM has $10.00 more to run to get there. That’s a lot for an older gent.
In the middle top is Regional Banks KRE. That’s one sector that is running into resistance from February and October highs at 57.52.
Far right is the troublesome sector. IYT closed down for the week. the With the prior week’s close at 195.37, this week it closed at 192.68.
What’s wrong with IYT?
For now, it seems our Tran is not buying into the Santa rally theory.
For my money, I will be watching IYT to either get through 195 and alleviate the tension, or break below 188.25 and send an ominous signal to his brethren.
On the bottom row, we see Retail XRT. Should IYT cooperate, this sector over 45.41 has upside potential. 44.00 or the green line 200-week moving average needs to hold.
In the middle you see where the speculators have been buying. What you do not see is the resistance at its 2018 highs or 122.97.
Yes, this has been a mover and a shaker. However, as high as IBB is, it’s still far from its 2018 highs and significantly far from it’s zenith high in 2015.
Finally, the female representative of the sector Family, Semiconductors SMH, held on.
She gave us a fright the day she gapped lower. But, back she came to close shy of the all-time high 135.26.
With all this good news, what can throw a wrench into the party?
First, the back and forth trade news or fake news.
Secondly, Mr. Powell. Should the Fed hint that rates can rise given the jobs report, Gramps and the gang’s resolve will be tested.
Finally, please review the Daily from 12/05/19 on Emerging Markets with actionable info for 2020.
S&P 500 (SPY) 312.80 or the 10 day moving average support. 315.48 is the all time highs.
Russell 2000 (IWM) 161.10 price support at 162 is pivotal and 163.41 Friday high, new 2019 high.
Dow (DIA) 279.30 the 10 day moving average support. 281.91 ATH.
Nasdaq (QQQ) 203.66 or the 10 DMA support 206.05 ATH.
KRE (Regional Banks) 56.00 is pivotal while 57.52 is major price resistance.
SMH (Semiconductors) 132.40 or the 10 day moving average is support; 135.26 is the all-time highs.
IYT (Transportation) 188.25 is key price support and if fails, will impact everything. Price resistance is at 193.55 then 195.
IBB (Biotechnology) 116.30 is key price support; 122.97 is the 2018 high.
XRT (Retail) 44.15 is price support, while 45.41 has to clear next.
Twitter: @marketminute
The author may have a position in the mentioned securities at the time of publication. Any opinions expressed herein are solely those of the author, and do not in any way represent the views or opinions of any other person or entity.


