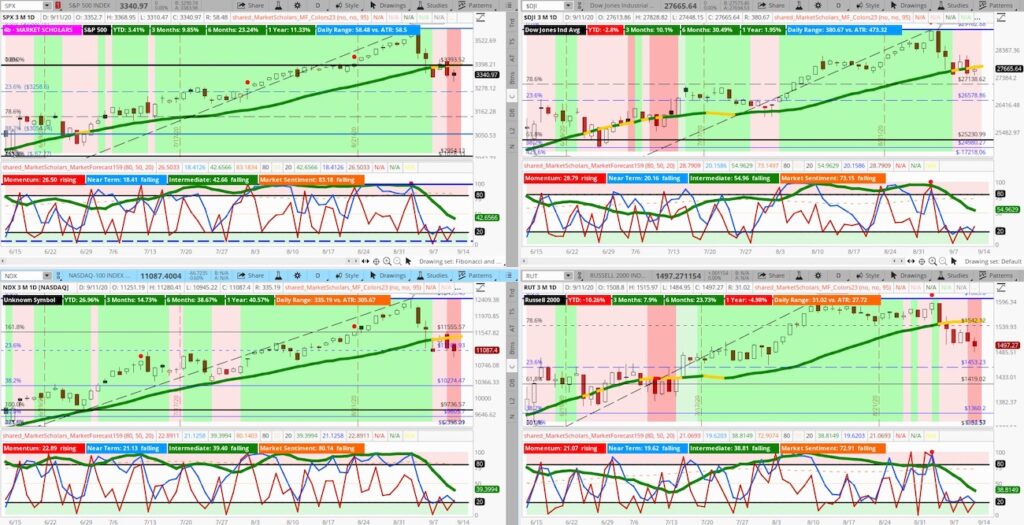
The Market Forecast indicator is showing a bearish intermediate posture but is not confirmed with a falling six-week moving average.
Also, the weekly chart is showing a bullish intermediate confirmation signal.
These two patterns suggest there may be a short-term bounce in risk appetite heading into and, potentially, through options expiration over the next couple of weeks.
Multiple indicators are showing signals that appear bearish but are more “buy-the-dip” signals, including RSI, CCI, DMI and Ichimoku Cloud.
The S&P 500 has support in this area at the top of the value area on its one-year Volume Profile.
Volatility is also showing a “buy-the-dip signal” with the VIX dropping to a bullish level relative to VIX3M. This suggests we’re actually more bullish than it appears with volume and trading ranges potentially peaking too.
Rising inflation expectations are having a bullish impact on Treasury yields – to a small degree – and a bearish impact on the US Dollar. A weakening greenback is bullish for risk appetite in the long term, even if we see a “real” intermediate pullback develop soon.
Weekend Stock Market Outlook Video
Technology and Communication Service who had the most mature trends previously suffered the biggest losses this week (aside from Energy). Other cyclical areas like Materials and Industrials held up better in a precursor of what rotation could look like during a “real” pullback.
Get market insights, stock trading ideas, and educational instruction over at the Market Scholars website.
Twitter: @davidsettle42 and @Market_Scholars
Any opinions expressed herein are solely those of the author, and do not in any way represent the views or opinions of any other person or entity.

: Showing Some Signs of Emerging Strength")
