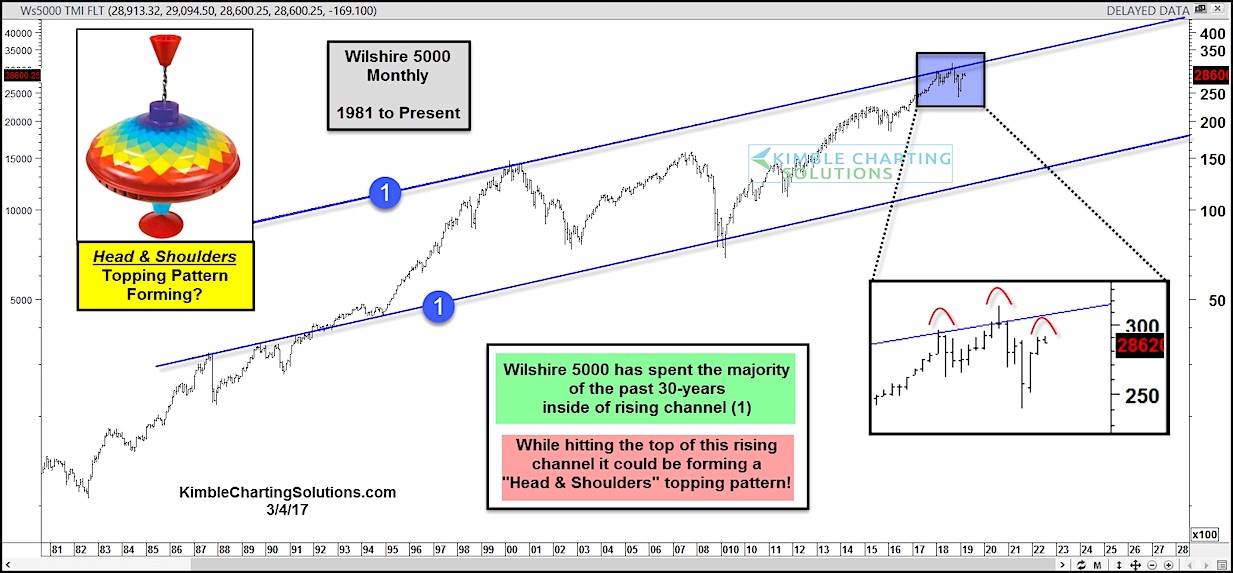
The Wilshire 5000 Index has spent the past 30 years trading within a bullish price channel up-trend – see (1) in today’s chart below.
Though the latest move off the 2009 lows has been bullish, and quite strong, it has taken the broad stock market index to the top of this bullish channel.
That alone is reason for concern as this appears to be slowing the bull market down. But there’s more…
While hitting the top of the channel, the Wilshire 5000 has taken the shape of a “still forming” head and shoulders topping pattern.
All eyes on that potential right shoulder!
Long-term bulls do not want to see this broad stock market index forming a Head & Shoulders topping pattern right here as there is plenty of room to the downside. Stay tuned!
Wilshire 5000 Index “monthly” Chart
Note that KimbleCharting is offering a 2 week Free trial to See It Market readers. Just send me an email to services@kimblechartingsolutions.com for details to get set up.
Twitter: @KimbleCharting
Any opinions expressed herein are solely those of the author, and do not in any way represent the views or opinions of any other person or entity.


: Showing Some Signs of Emerging Strength")
