The New York Stock Exchange (NYSE) is a very broad measure of the stock market with over 2400 companies listed. So when the NYSE begins to underperform, market participants should pay attention!
Well, this has been happening over the past year… and it may be reaching a tipping point.
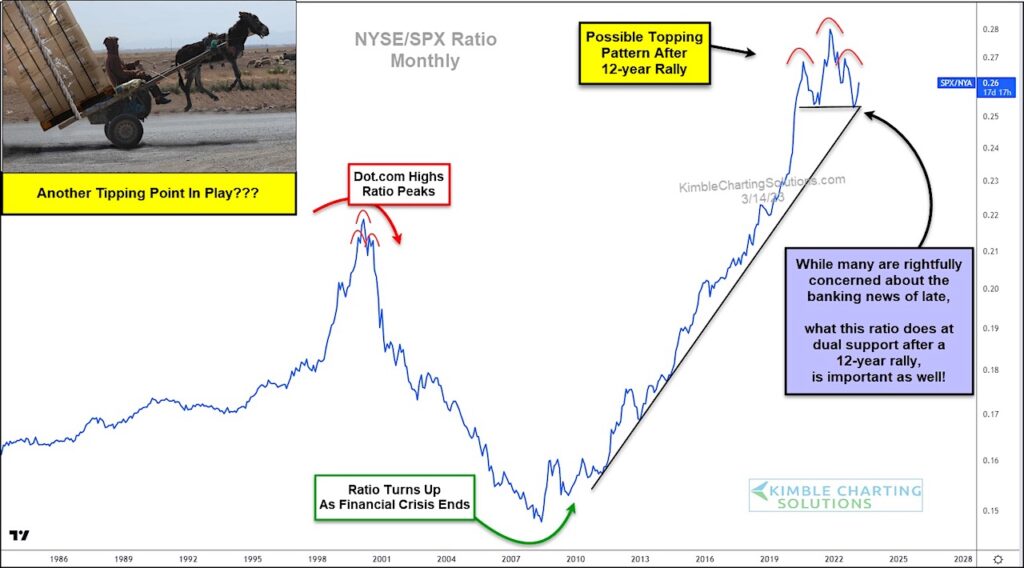
Below is a long-term ratio performance chart of the New York Stock Exchange to S&P 500 Index. You can see how the NYSE has turned lower of late in a topping-like formation.
More importantly, we ask if this topping formation could be a head and shoulders pattern? The last head and shoulders pattern of consequence appears at the Dot.com highs. Yikes!
Currently, this pattern bounced off of 12-year uptrend support. But with the banking news of late, this ratio is still trading on thin ice.
If this thing tips over at this support level, it would send an important cautionary message to the broader market. Stay tuned!
NYSE / S&P 500 Index “monthly” Chart
Note that KimbleCharting is offering a 2 week Free trial to See It Market readers. Just send me an email to services@kimblechartingsolutions.com for details to get set up.
Twitter: @KimbleCharting
Any opinions expressed herein are solely those of the author, and do not in any way represent the views or opinions of any other person or entity.


