It’s that time again.
The time when we examine the weekly charts on the Modern Family.
This past week, the market continued to climb higher.
Three of the four indices are in accumulation phases on the daily chart, which means, they cleared their 200 daily moving averages.
The holdout?
Our cowboy, Granddad Russell 2000 IWM.
Furthermore, as we will look at in a moment, several Modern Family members improved in phase on the weekly charts.
Last week I made a prediction:
“If the Russell 2000 IWM reaches 157.00, that could be it for this rally.
And if it cannot get there, watch Transportation to hold or fail 189.74.”
How is that prediction looking for this week?
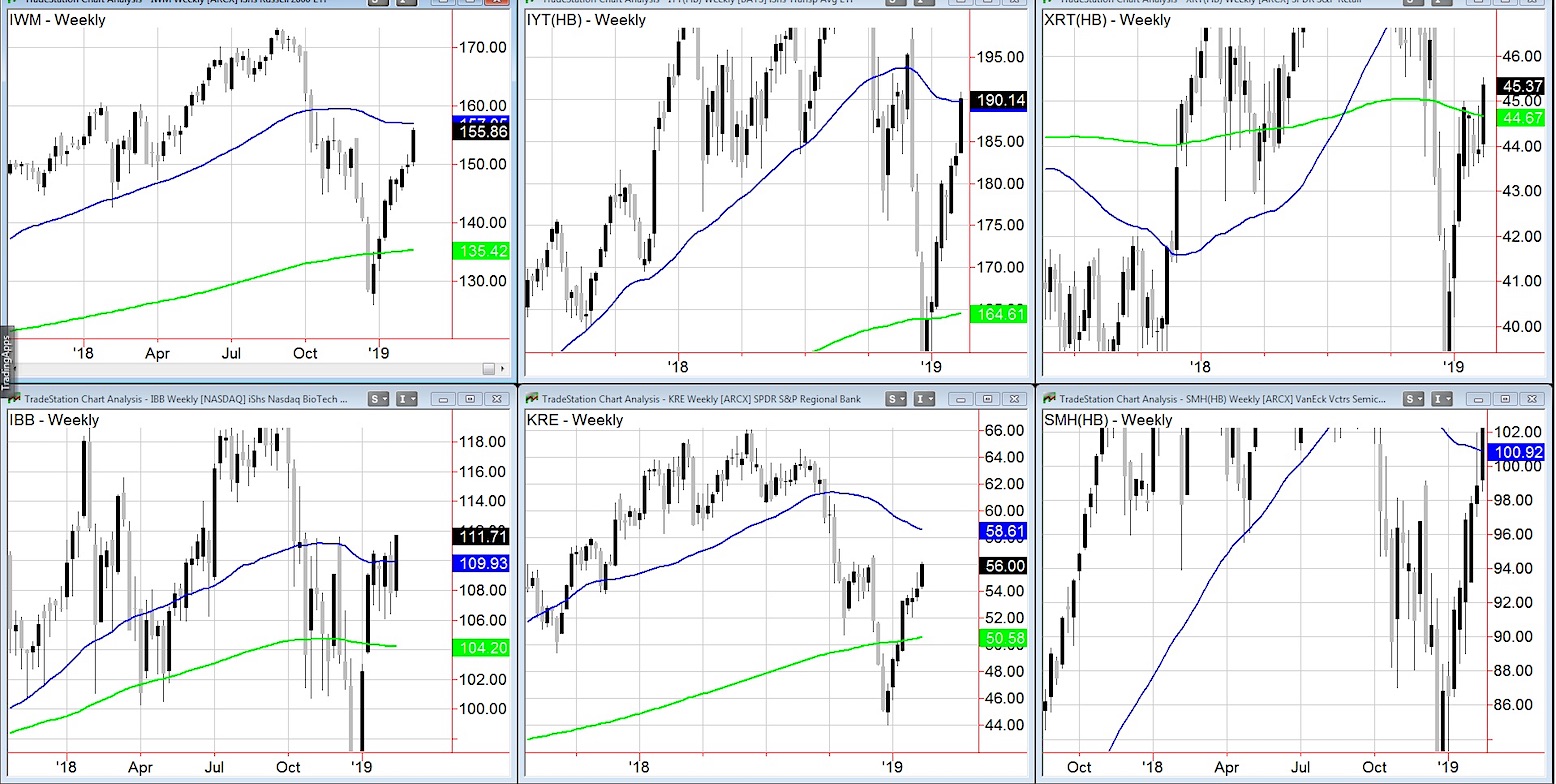
From top left to right:
The Russell 2000 (IWM), Transportation (IYT), and Retail (XRT).
IWM is not quite at the now rising sloped 50-week moving average (blue). The 157 number is derived from that resistance. Should it make it through and hold, we are looking at 160 next. Should it fail to clear, we then move to the right and examine IYT.
IYT did close above the 50-WMA this past week. The number is 189.76. If IWM clears 157 and heads towards 160, then IYT will head towards 200. Yet, if IWM fails to reach the 50-WMA and this turns down below its 50-WMA, fair warning.
Next, is Granny Retail XRT. In spite of terrible news on retail sales, Granny is buying the possibility the Fed cuts the interest rates. If that does indeed happen, forget the Family. Not only does it mean that the numbers are pointing towards a real slowdown, it will most likely mean that commodities will play a serious catch up as equities fall.
Besides that, XRT now has to hold 44.67 the 200-WMA in order to have a chance to move up towards its 50-WMA at 46.80.
Next row from left to right. Biotechnology (IBB), Regional Banks (KRE) and Semiconductors (SMH).
Biotech is where the happy-for-now speculators live. 109.94 is the 50-WMA that needs to hold with lots of overhead resistance to clear.
Regional Banks got to 56.00, an area of resistance. That level has to hold up for one, and for two, the negative slope above on its 50-DMA most likely will not clear.
Finally, SMH got its first close over the 50-WMA since September 2018. That makes 100.92 the support to hold. For Tuesday, 102 is the first pivotal support area.
With lots of resistance all the way up in every chart, it will be interesting to see how long bad news (low industrial production, poor retail sales and a rise in jobless claims) is interpreted as good news for the market because of the dovish Fed.
S&P 500 (SPY) – A move to 280.40, if cannot clear, might stop this rally in its tracks
Russell 2000 (IWM) – 157 is the 50-WMA and 157.86 the 200-DMA. Can it clear? If not, you have a plan.
Dow Jones Industrials (DIA) – 258.00 is the immediate level to hold come Tuesday
Nasdaq (QQQ) – 171.88 the 200-DMA now the level to hold come Tuesday. Huge resistance at 175.
KRE (Regional Banks) – 56 pivotal for Tuesday.
SMH (Semiconductors) – 100.92 key pivotal area on weekly chart. Lots of overhead resistance from here
IYT (Transportation) – 189.76 pivotal point. Plus, this cleared the 200-DMA so that makes 190.18 the first place to look
IBB (Biotechnology) – 109.92 the pivotal point. 112 resistance
XRT (Retail) – 44.67 pivotal for the week.
Twitter: @marketminute
The authors may have a position in the mentioned securities at the time of publication. Any opinions expressed herein are solely those of the author, and do not in any way represent the views or opinions of any other person or entity.


