The questions about the sustainability of broad stock market improvements raised earlier this week are being answered with resolution to the upside.
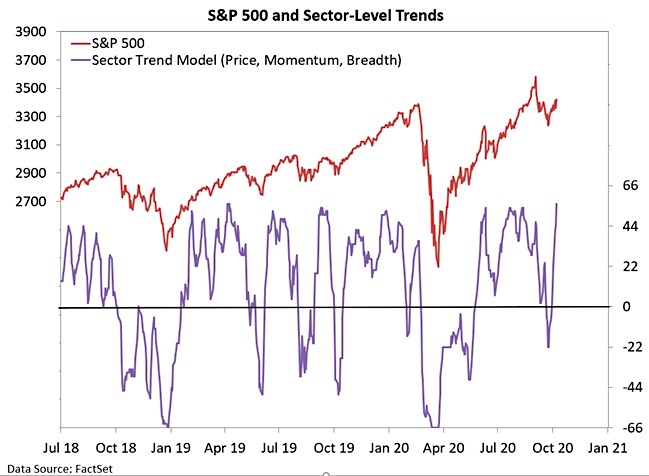
Stock market breadth indicators nearly broke-down in late September: the percentage of S&P 500 stocks above their 50-day average dipped below 50%, the percentage of world markets above their 50-day averages dropped to nearly 25%, and our sector-level trend model moved into negative territory.
Since then, these have all seen marked improvement – now, two-thirds of the stocks in the S&P 500 Index INDEXSP:.INX are above their 50-day averages (nearly 70% are above their 200-day averages, a new recovery high). The percentage of world markets above their 50-day averages is approaching 50% (below 40% is bearish, above 70% is bullish). Our sector-level trend indicator is not just back in positive territory, but has climbed to its highest level in 18 months – the improvement that began in late September and has accelerated this week is indicative of a stock market rally that is firing on all cylinders and being supported by increasingly broad participation.
After deteriorating in August and remaining weak in September, our NASDAQ breadth model is showing some life.
The number of stocks making new highs is expanding but does not appear exhaustive. Yesterday, the Dow Transports made a new all-time closing high.
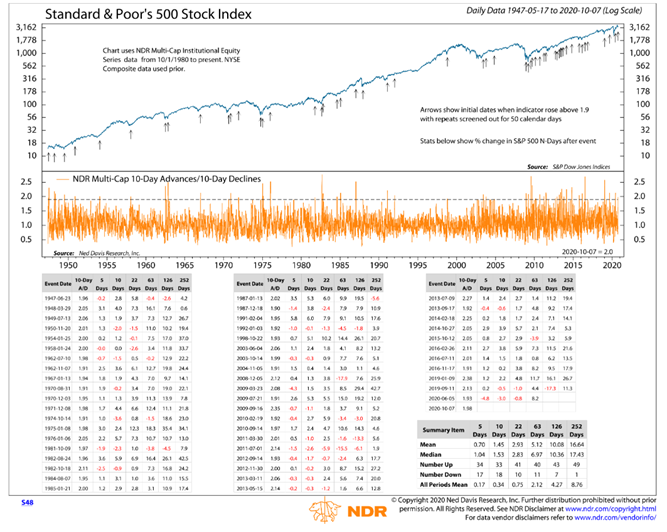
It looks like we can add to the list of improving conditions a new round of breadth thrusts. Over the past 10-days, advancers have outpaced decliners by 2 to 1 (above 1.9 is a breadth thrust) and 89.6% of stocks are above their 10-day averages (90% is the threshold for a breadth thrust). Getting the percentage of stocks above their 50-day average above 90% (currently 67%) would also be a breadth thrust. Historically, breadth thrusts provide a bullish tailwind for equities that can last for up-to a year.
I had a chance this week to discuss some of these breadth developments and what it could mean for small-cap leadership going forward with Oliver Renick (https://bit.ly/34rLWXa) and Dave Keller (https://bit.ly/3jURvEp).
The Bottom line: optimism is quickly rebuilding, valuations have become more troubling, but breadth has proven to be resilient and is going to be a key support of the next leg higher in the cyclical rally. Keep an eye out for sustained small-cap leadership.
Twitter: @WillieDelwiche
Any opinions expressed herein are solely those of the author, and do not in any way represent the views or opinions of any other person or entity.

 Testing Important Price Support")
: Cup (and Maybe Handle) Watch")

