Elevated steel prices have consumers (and investors) concerned about inflation. And whether inflation strengthens or lightens up may depend on the next move in steel prices.
After a huge rally out of the coronavirus crash low, steel prices peaked this summer but have been in consolidation mode ever since.
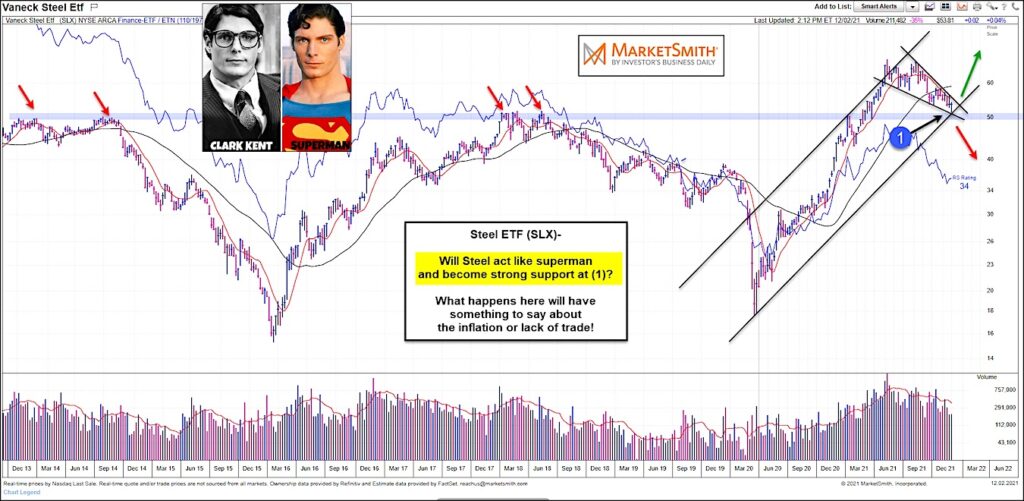
As you can see in the chart above, the Steel ETF (SLX) has been narrowing of late and may soon break higher or lower.
Bulls are hoping the blue breakout line (that once was resistance) now holds as support. And all this may soon be coming to a head at (1).
What SLX does next should provide a clue to the next big move in inflation or lack of inflation for a while. Will steel act like Superman and head higher once more? Stay tuned!
Note that KimbleCharting is offering a 2 week Free trial to See It Market readers. Just send me an email to services@kimblechartingsolutions.com for details to get set up.
Twitter: @KimbleCharting
Any opinions expressed herein are solely those of the author, and do not in any way represent the views or opinions of any other person or entity.

: Worrisome to Broader Market?")
