This week’s State of the Union Address (SOTU) was filled with evidence of inflationary pressures that will keep inflation burning because…
Once ignited, inflation is like a wildfire capable of continuing to burn under the surface and re-igniting unexpectedly.
This is not meant to be political. As we have written many times, politics and investing should not be in the same sentence.
With that said, during the State of the Union Address, we were keenly listening for comments related to the macro themes we reported in our 2023 Outlook that we believe could spike inflation again and keep the market in a trading range.
Inflationary macro themes:
Build in America: Yes, having USA made semiconductor chips could save us money and create jobs. So will turning our attention to infrastructure. The President pointed out that the US is ranked 13th in the world in infrastructure. BUT there are 11 million jobs unfilled. And many tech companies are trimming jobs. The mindset for US growth feels very “60 years ago.” No mention of automation (replacing jobs). No mention of the metaverse removing the need for brick and mortar. No mention of the aging population and declining birth rate. No mention of the efficacy of technology such as 3D printing to replace materials that grow from the earth for building houses. In fact, NO mention of the digital world at all or how we must prepare for the inevitability of it. AI and technical efficacy can become dystopian if only the wealthy enjoy the benefits.
- 37.3 million Americans—about 1 in 10—have diabetes. About 1 in 5 people with diabetes don’t know they have it. So yay, insulin is cheaper. But no mention of preventative care or nutrition awareness. And if you read our Outlook, sugar consumption is one of the underlying harbingers of inflation and social unrest. Sugar prices have quadrupled since 2020.
- USDA reports that China accounted for 383,935 acres, or 0.9% of total foreign-owned US agricultural land as of year-end 2021. The US aggressively sends money and resources to places devastated by weather events. Until we are more efficient in growing, cultivating, and distributing food, in spite of what Mother Nature has in store, with the increase of these natural disasters, food costs should continue to rise.
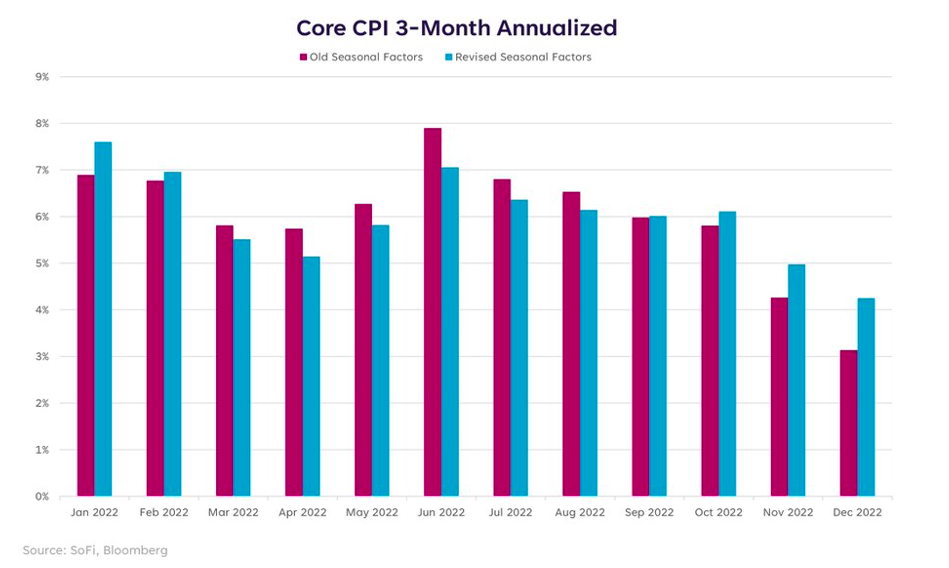
The media will focus our attention on the components of CPI and other economic inflation indicators, but until the foundations of inflationary pressures like the ones mentioned above are addressed, inflation is likely to remain persistent and flare up unexpectedly.
The purpose of this addendum is to inform and prepare you for how to invest should the trends already in place continue to spiral.
For an actionable trade idea that can benefit from an inflationary environment, please read on.
We at MarketGauge have lots of tools and scanners, as well as trading models and blends, that help you find stocks set up to trade.
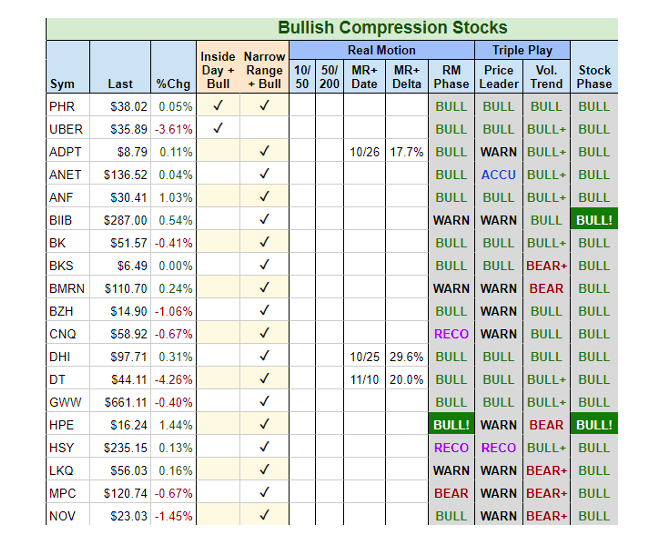
This screenshot is from our Complete Trader product after the close on February 9th.
We focus on “bullish compression” or stocks in bullish phases that are consolidating and potentially ready to go higher.
For our part of the research and to narrow down the picks on the scan, we added a discretionary filter based on our research and bias of more inflation coming.
The top columns show the scans for inside days (when the trading range is within the range of the day prior).
Narrow range day (the trading range is much smaller than what is typical).
MR is mean reversion as evidenced by our Real Motion Indicator. Then comes the Triple Play (indicator) that tells us how the instrument is performing compared to the benchmark.
It also includes a volume trend indicator that measures volume along with the price movement in a stock.
The Stock Phase is the phase it is in according to our 6 phases, all of which are fully described with examples in Mish’s book: Plant Your Money Tree.
On Friday, Mish did a segment for StockchartsTV called “Your Daily Five: What Might Outperform In A New Wave of Inflation,” in which she reviews 5 actionable trading ideas.
One of the stocks covered in that segment, NOV, came from the Complete Trader table above.. You’ll find NOV in the last row of the screenshot image above.
NOV is in the energy sector-a macro theme and an area covered during SOTU.
NOV had a narrow range day coming into Friday, which is a pattern that often precedes big trend days.
The Real Motion or Momentum Phase is bullish.
NOV underperformed the benchmark and showed a bearish volume trend.
Its stock phase is bullish.
Friday, the stock had a big trend day and climbed more than 4%, while the SPY closed flat.
Our 2023 Outlook e-book refers to the oil market as the X-factor for how high and how long inflation could run. As a result, we expect the energy sector to continue to be a great source of good trades in 2023.
Stock Market ETFs Trading Analysis & Summary:
S&P 500 (SPY) 420 resistance with 390-400 support
Russell 2000 (IWM) 190 pivotal support and 202 major resistance
Dow Jones Industrials (DIA) 343.50 resistance 338 support
Nasdaq (QQQ) 300 the pivotal area 290 major support
Regional banks (KRE) 65.00 resistance 61 support
Semiconductors (SMH) 248 resistance 237 then 229 support
Transportation (IYT) The 23-month MA is 244-now resistance 228 support
Biotechnology (IBB) Sideways action 130-139 range
Retail (XRT) 78.00 the 23-month MA resistance and nearest support 68.00
Twitter: @marketminute
The author may have a position in mentioned securities at the time of publication. Any opinions expressed herein are solely those of the author and do not represent the views or opinions of any other person or entity.


