 Since the S&P 500 (SPX) dipped to 1536 on April 18, the market has rallied nearly 100 points. The latest move has capitulated many bears and might be a sign the market is nearing a short-term inflection point. Let’s take a quick look at the charts.
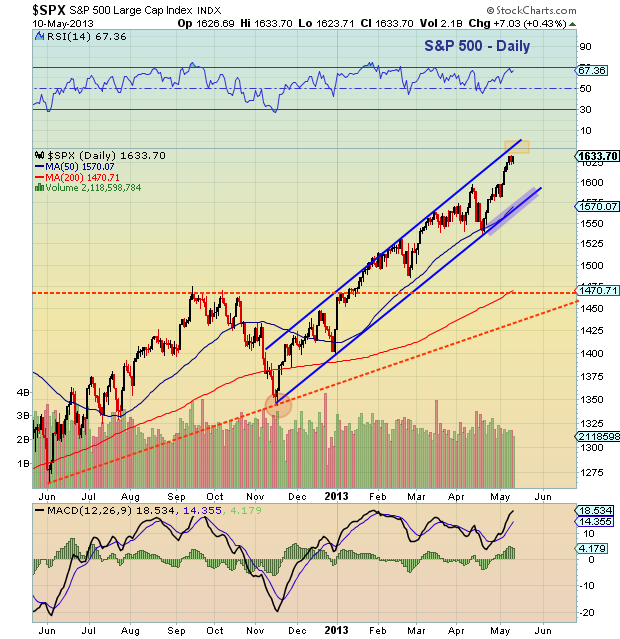
Below I have included daily Macro and ZOOM charts. The Macro chart offers a longer-term look with the channel trend, while the Zoom Chart has a near-term focus. In the macro SPX macro chart, price pivoted off the uptrend line and accelerated towards the upper channel line (1650-1660). Price is now almost 12 percent above the 200 day moving average, so we’re getting a little frothy. But as long as the SPX is above trend, it’s macro status is bullish. Levels to watch that would bring caution if broken are the 1597 pivot and the the uptrend line/50 day moving average.
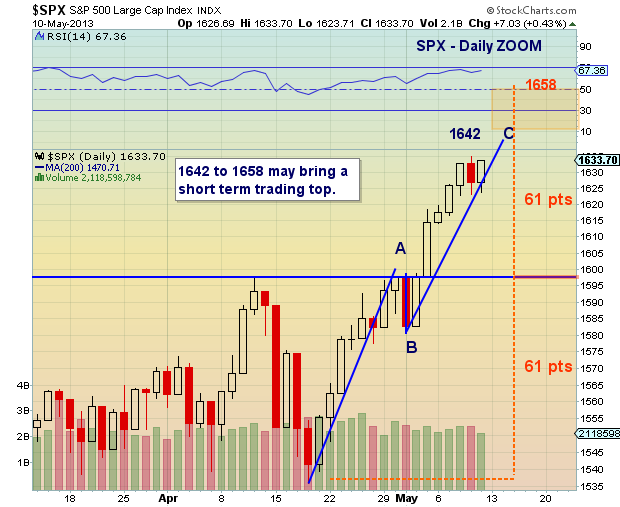
In the short-term chart, the SPX is on bar 8 (today) of a daily 9 sell setup. A new high this week would perfect the setup and could bring a short-term trading top. If we go higher, two areas I am watching are 1642 (measured move) and 1658 (symmetry with down move, using 1597 as pivot).
S&P 500 Daily Macro Chart
S&P 500 Daily ZOOM Chart
Good luck this week. Trade safe, trade disciplined.
Twitter: @andrewnyquist and @seeitmarket
Positions long and short SPX.
Please check us out on Alexa and feel free to provide a review with feedback.


