Bonds and Stocks – Intermarket Analysis
The relationship between bonds and stocks represents another major linkage in intermarket analysis.
Bond and stock prices typically trend together. When bond prices peak and turn lower (resulting in an increase in bond yields) this usually spells the end of an equity bull market.
The long-term (again 20-year, weekly) ratio chart between the 30-Year U.S. Treasury Bond prices and the S&P 500 index illustrates this very well.
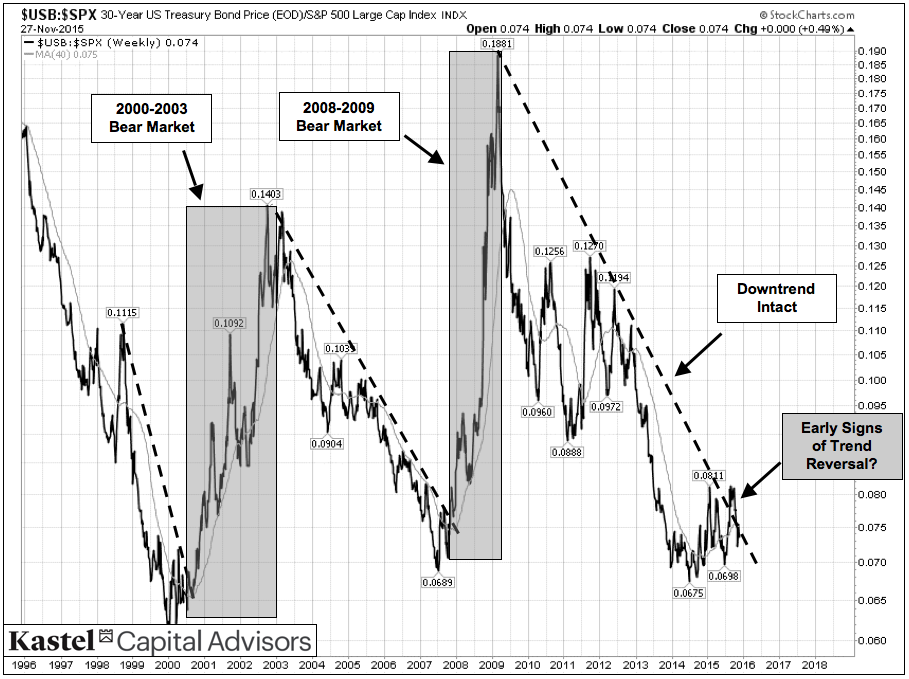
The bond-stock ratio declined throughout the 1990s bull market. Inflationary pressure from commodities and the subsequent increase in interest rates brought the rally in long bonds to its end in late 1998 (bonds typically peak months ahead of stocks).
The bond-stock ratio reversed in 2000, broke out over the trendline, and along with commodities also provided a clear signal of a major turning point for the U.S. equities.
An almost identical situation occurred in late 2007 as the ratio again reversed, moved over the trendline, and signaled the end of an equities bull market.
Like the commodity-stock ratio, the bond-stock ratio has been in a well-defined downtrend since 2009, but with some noteworthy differences.
First, long-dated U.S. Treasuries peaked in April of this year and have been consolidating at a lower level since.
Additionally, the bond-stock ratio is currently flirting with the trendline, likely due to expectations of the Federal Reserve increasing interest rates in the short-term.
A decisive move higher in this ratio would be an indication of an approaching turning point for the U.S. equities.
The “Deflation” Caveat
Due to constant changes in the global macroeconomic dynamics, markets continually evolve and so do their intermarket relationships.
One of the biggest macroeconomic changes over the last three decades has been the gradual shift from global inflation to “disinflation” (prices rise at a slower pace) to the current threat of global deflation (prices actually decline).
Under deflationary conditions the traditional relationship between commodities and stocks reverses and they become closely correlated.
It is premature to declare that the U.S. is headed toward deflation. On the contrary, there is actually some evidence that inflationary pressures are again starting to build.
However, if deflation were to happen, commodities and U.S. equities would likely fall together, while bonds would diverge and head in the opposite direction.
Conclusion
Intermarket analysis is extremely valuable in understanding the global relationships between macro asset classes. It has also historically provided an effective way to identify major market turning points.
Despite the very old bull market in the U.S. equities, intermarket analysis is not indicating that a major turning point is imminent at this time.
Should the commodities reverse and/or U.S. bonds confirm a top, this would likely spell the end of the current U.S. equity bull market.
In the less likely scenario the U.S. economy goes into a full-blown deflation, commodities would remain weak, the U.S. equities would fall with them, while the bond prices would diverge and remain strong.
Twitter: @KastelCapital
Any opinions expressed herein are solely those of the author, and do not in any way represent the views or opinions of any other person or entity.


