Stocks rallied for the third consecutive week last week. Can the stock market make it 4 weeks in a row this week?
The rally last week was led mainly by crude oil, and small caps stocks, with the financials sector not far off. This undercurrent of support propelled the S&P 500 higher into the beginning of a thick price resistance zone.
Intraday levels of the McClellan Oscillator $NYMO reached levels not seen since 2008 last week and the indicator has remained overbought for the past 2 weeks. I certainly agree some of the market breadth indicators are overbought but that potentially has been the fuel for higher prices and what may be on the horizon for the next few weeks.
There has been quite a bit of consolidation and this has kept the Relative Strength Index (RSI) from getting too far ahead of itself. Overall the active has been quite constructive. Higher prices may be up next as many investors are still skeptical of the rally and continue to look for short opportunities with each move higher… and price keeps going higher.
That said, the longer term picture still shows lower highs which indicates that the market is still in a downtrend. The shorter-term bullish posture is threatening that, but that remains to be seen. Various sectors have shown strength recently, but broad leadership is still lacking. Lots of laggards bouncing sharply.
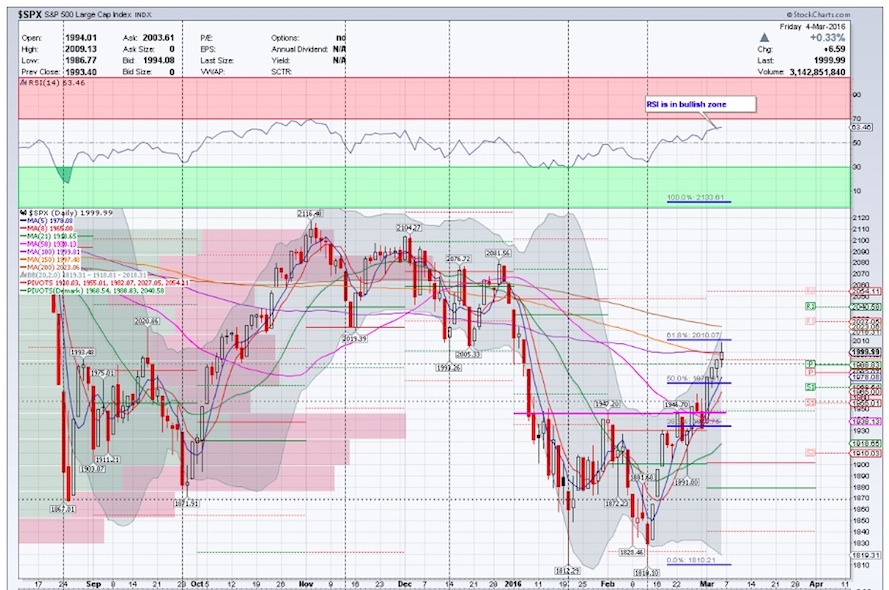
Below is a chart of the S&P 500 Index through last weeks close. You can see that RSI is in the bullish zone and indicates that the market is likely to consolidate gains here. The MACD is still rising and in good shape thus far. Stocks closed just above the 100 day simple moving average. While price may run to its declining 200 day SMA before a pullback, the ideal scenario will be to consolidate gains, then make a run higher towards the 200 day SMA. Momentum is still in the bulls favor but the bears are watching for any weakness.
S&P 500 Index (through March 4)
Market Breadth Indicators:
From a market breadth standpoint, there are a few charts that we should take a look at.
Sector Performance Review:
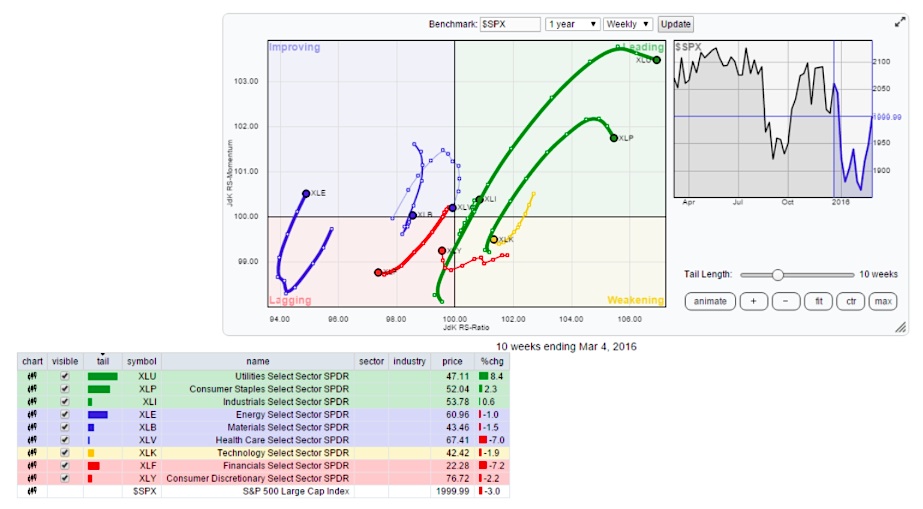
Looking across then core S&P stock market sectors, it’s clear most are acting bullish zone and rising near-term. Even laggards like the Financials (XLF) and Energy (XLE) participated in last week’s stock market rally. Healthcare sector (XLV) is a notable laggard that hasn’t participated int he broad 3 week rally. Overall, the action is constructive.
The Relative Rotation Graph (RRG) chart highlights the leaders and laggards across 9 key sectors.
CBOE Equity Put/Call Ratio:
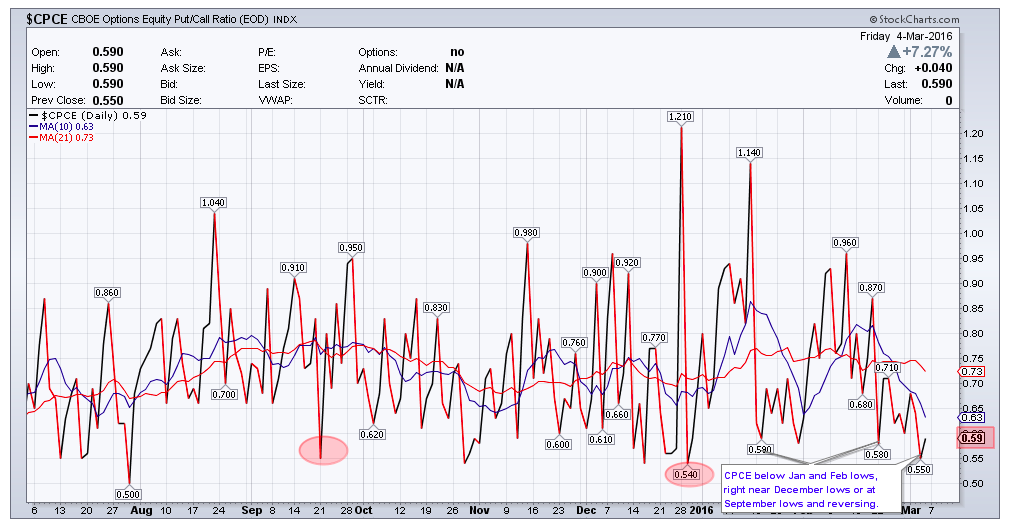
The Put/Call ratio has dipped below the Jan and Feb lows. Is this an indication of some sort of complacency? It’s possible. With many sectors and indices rallying so far so fast, a pop higher could be on the horizon. Watch the Volatility Index (VIX) – if it stays below 20, then the Put-Call ratio may remain low(er).
NYMO (McClellan Oscillator):
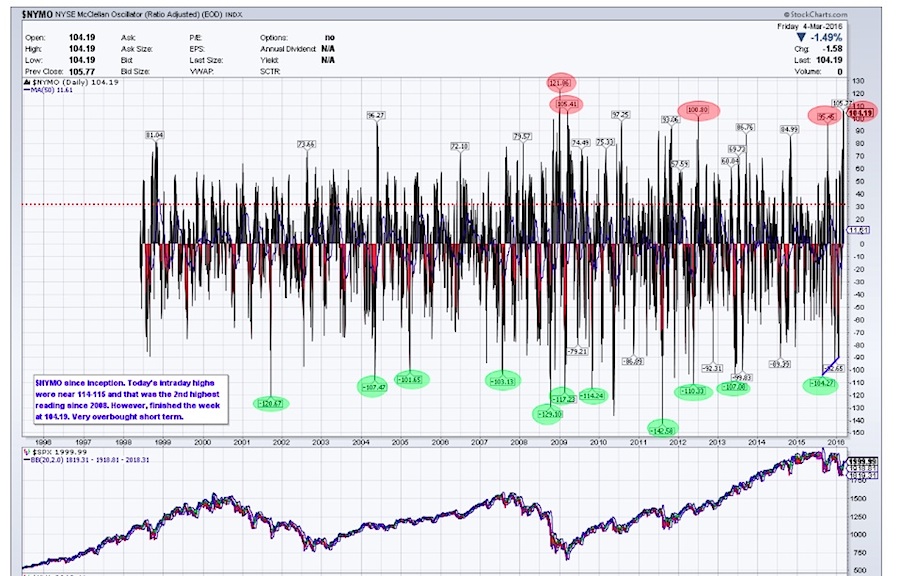
The intraday reading on on the McClellan Oscillator on Friday reached its highest reading since 2008 and settled just a tad below 2009 levels. Needless to say, it is overbought and stocks can use some consolidation.
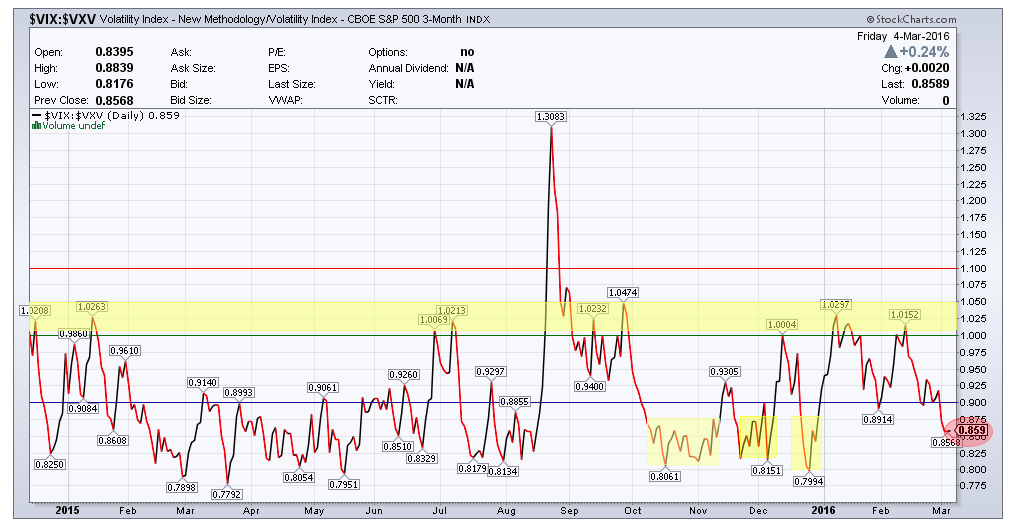
VIX:VXV Volatility Ratio
VXV is the 3 month volatility index. When the ratio between the VIX and VXV is > 1.00 it often spells trouble for stocks. This ratio continues to ease up. This is another indicator to watch here to see if the market consolidation will remain orderly or not.
Thanks for reading and good luck this week.
Twitter: @sssvenky
The author has a position in S&P 500 related securities. Any opinions expressed herein are solely those of the author, and do not in any way represent the views or opinions of any other person or entity.


