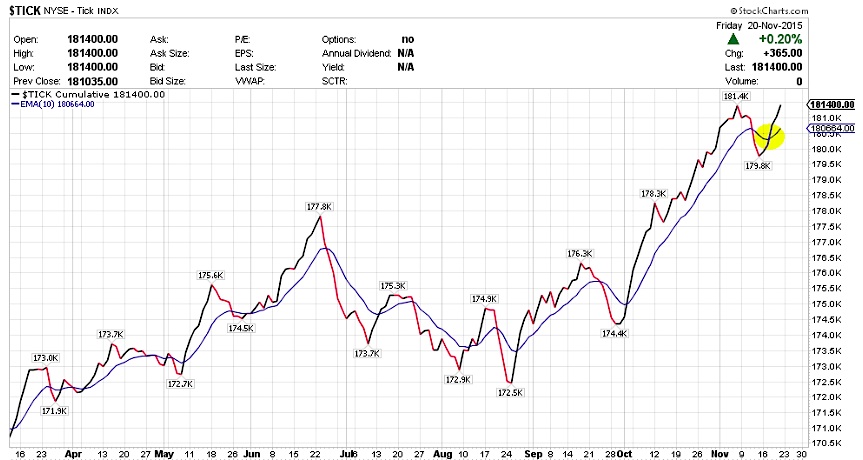
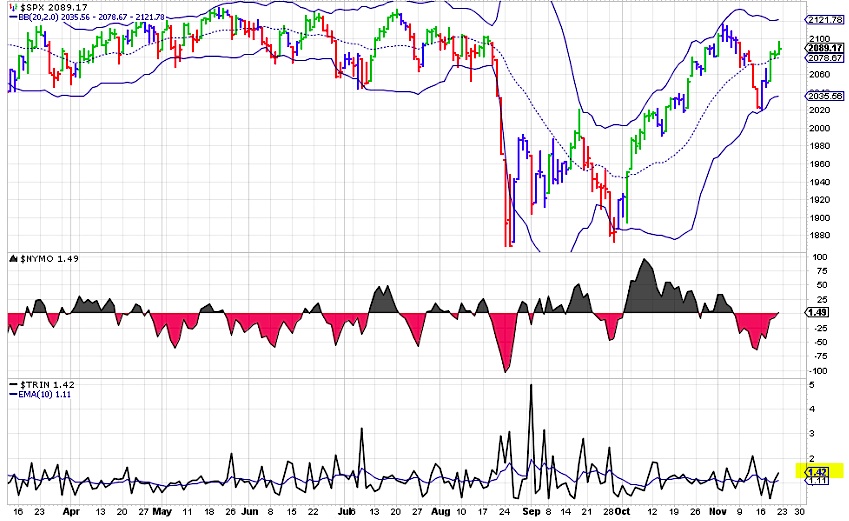
$TRIN & $TICK Market Indicators:
The $TICK indicator crossed back above its 10 EMA line and started moving higher.
Despite this move, one needs to track $TICK closely for any negative moves intraday that may eventually lead to any move lower.
The $TRIN indicator has been elevated a bit this past week, at least a couple of times. It ended the week at 1.42 which is relatively on the higher side. There was some choppiness in the indices and that can be a reason for this. I’m not expecting any major spike this upcoming week unless a catastrophic event takes place.
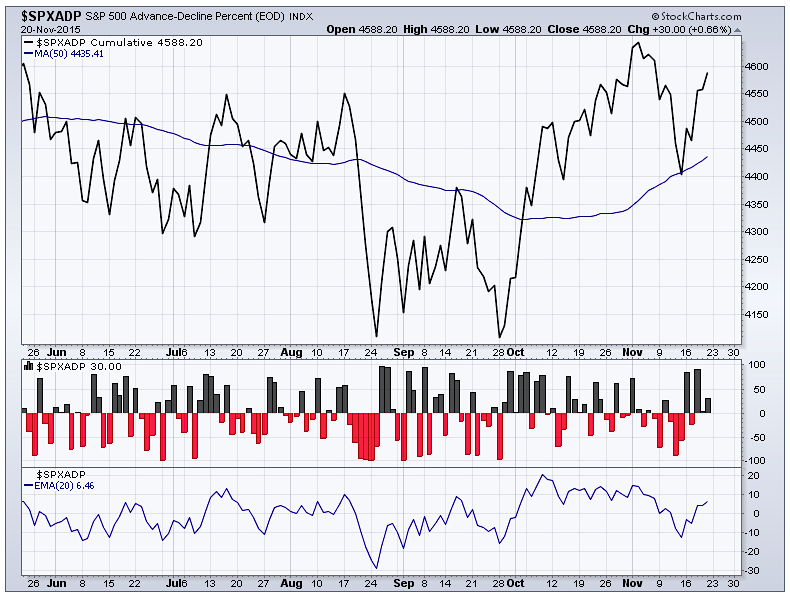
$SPXADX – Advance-Decline Percent Data:
The Triple view of the Advance Decline data for $SPX. The S&P 500 Advance-Decline Percent bounced off of the 50 SMA and now rising higher. New highs? If yes, then certainly will be watching S&P A/D line for a new high as well for any correlation. That’s the bigger picture view that I can really state here.
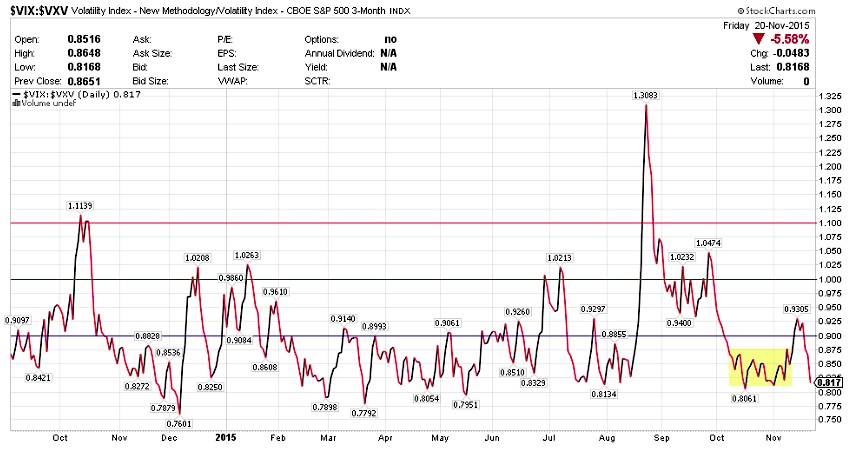
$VIX:$VXV – Volatility Term Structure:
$VXV is the 3 month volatility index. The relationship between $VXV and $VIX (30 day volatility) or the ratio between them if > 1.00 often spells trouble for equities. After a pop last week, this ratio is back near October lows at 0.817.
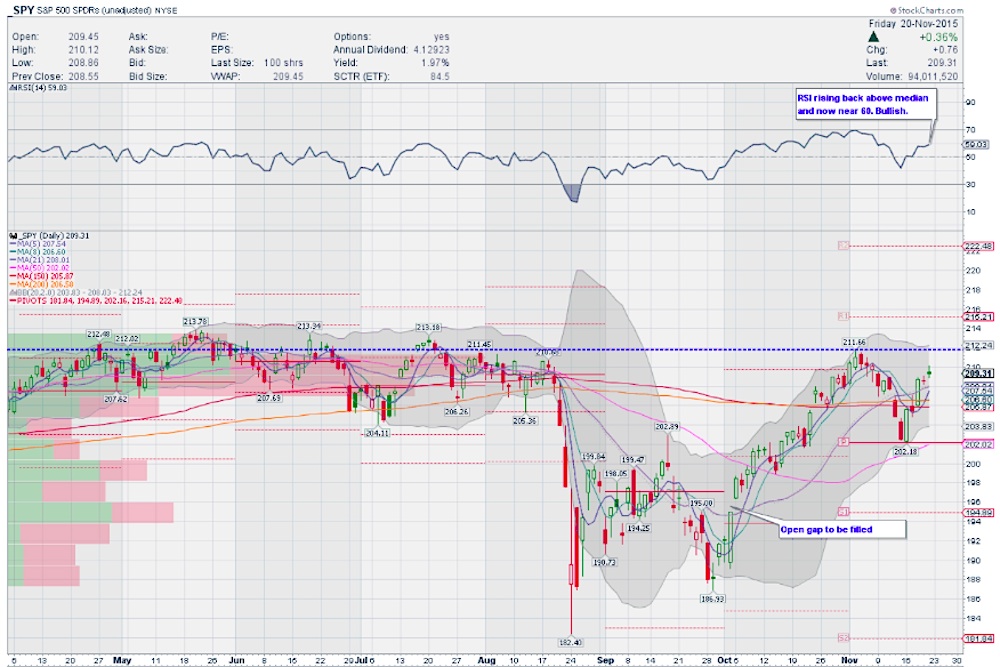
$SPY – S&P 500 ETF DAILY TIMEFRAME:
The S&P 500 ETF ($SPY) started last week strong with a bullish engulfing bar on Monday setting the stage for a strong week. That said, Thursday and Friday both printed DOJI candlesticks for the S&P 500 ETF. And two DOJIs one after another normally casts some trouble. Remember June/July timeframe? This is something to watch out for so it’s possible that we resolve lower after the holidays, so watch the price action. Also, note that if the 2011 analogy is true and still holds, then next week should be lower, not higher although the average Thanksgiving timeframe shows higher. These are scenarios to prepare for just in case.
As far as momentum indicators go, RSI is rising now and above median, nearing the 60 zone. MACD is starting to curl up for a possible bullish cross. Slow STO on this timeframe is rising and is in the bullish zone. 8 SMA is flat and turning and any pullback shorter term will allow the 8 SMA to rise. All this provides a more bullish outlook nonetheless. The measured move of this move is 214.20 to start with.
S&P 500 ETF (SPY) – Daily Chart
You can read more of my weekly analysis on my website. Thanks for reading and have a great week.
Twitter: @sssvenky
The author has a position in S&P 500 related securities. Any opinions expressed herein are solely those of the author, and do not in any way represent the views or opinions of any other person or entity.


