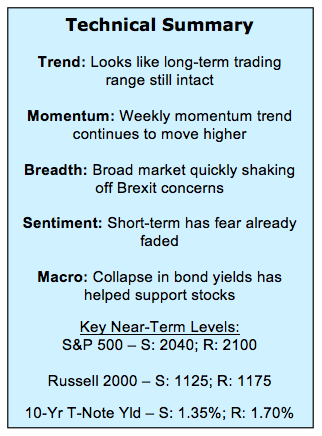
S&P 500 Weekly Outlook & Technical Review (July 8)
Here’s a look at some key stock market indicators and emerging themes that we are watching:
S&P 500 Trading Range Proves Resilient – While the S&P 500 Index (INDEXSP:.INX) posted its highest weekly close in a year last week, a broader look at the price action shows that the trading range that has been so dominant for the past 18 months remains intact. This stability in the U.S. at a time when markets around the world have made lower highs has led to relative outperformance for domestic stocks against global benchmarks.
Breadth & Momentum Trends Moving Higher – While the price churning that began in 2015 has continued in 2016, breadth has improved and longer-term momentum trends are moving higher. This argues for an eventual upside breakout and improves the S&P 500 weekly outlook.
Evidence To Argue For A Break-Out – Improvement in two specific areas would argue that the S&P 500 is poised to break out to the upside. Better relative performance by the Financials sector (especially the broker/dealers group) or small-caps would suggest that the consolidation phase on the S&P 500 has run its course.
Stock Market Indicators – Indices & Sectors (click to enlarge)
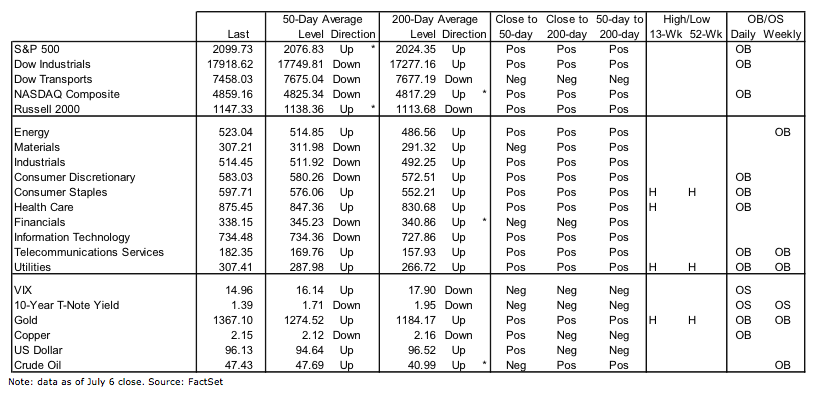
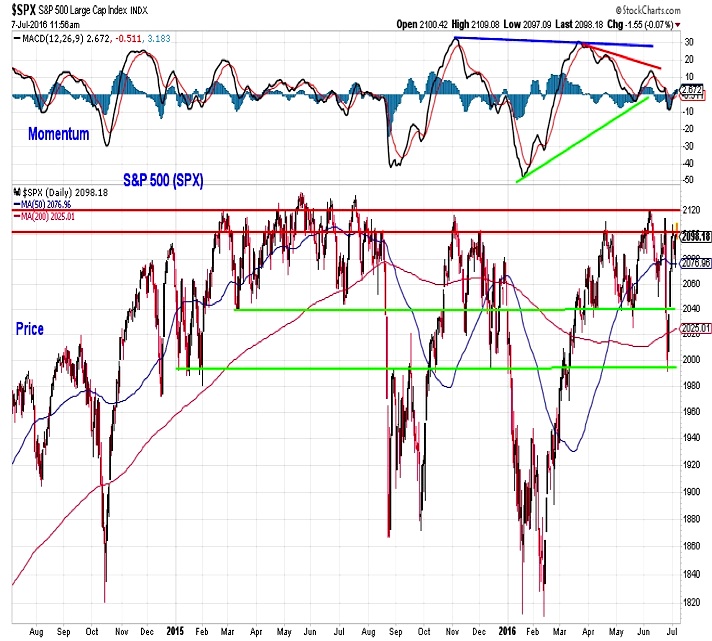
S&P 500 Index
The S&P 500 has quickly rebounded from the post-Brexit weakness, although the deteriorating trend in daily momentum that was present before that selling emerged remains intact. From a price perspective, resistance on the S&P 500 emerges between 2100 and 2120, while 2040 and 2000 appear to be important support levels. These are levels that have been well-contested over the past year and a half.
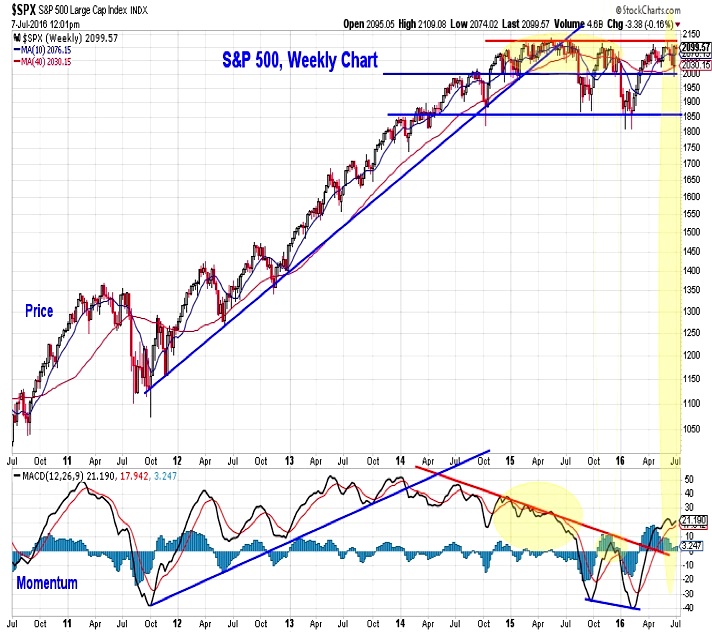
Fallout from Brexit is even more difficult to discern on the weekly chart of the S&P 500. While the daily momentum trend weakened over the course of the second quarter (and continues to argue for further near-term price consolidation), the weekly momentum trend is more encouraging. When price was testing the 2100 level over the course of 2015 weekly momentum was trending lower. Tests of 2100 in 2016 have come with weekly momentum expanding and breaking out above the down-trend of the past two-plus years.
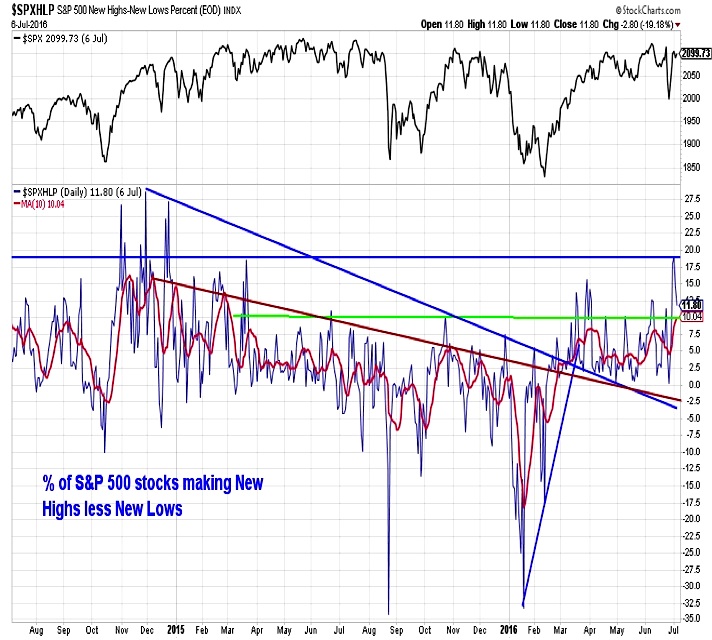
We showed a chart of net new highs on the NYSE & NASDAQ in last week’s update (available here), and this week show net new highs for the S&P 500. On a daily basis, last Friday saw the largest percentage of new highs since 2014. The 10-day trend has now surpassed the highs from earlier this year and is back to the level seen in the first quarter of 2015. On both a daily and 10-day trend basis, the down-trends that emerged in 2015 have been broken and the new high list is expanding in 2016.
continue reading on the next page…


