The latest rally attempt may be stalling out here. And next week is shaping up to be an important one.
Here’s our latest look at key technical and fundamental indicators and market trends for the trading week ending April 27, 2018.
Key Takeaways: The April rally in stocks has stalled with the S&P 500 and other popular averages making lower highs. An upside breakout in momentum remains lacking and stocks continue to work through a volatile period of consolidation. The latest rally has brought in some investor optimism without a meaningful improvement in breadth. If the next leg for stocks is going to be higher, we likely need to see less optimism and better breadth on rallies.
Rally Stalls… Watch Market Breadth & Sentiment
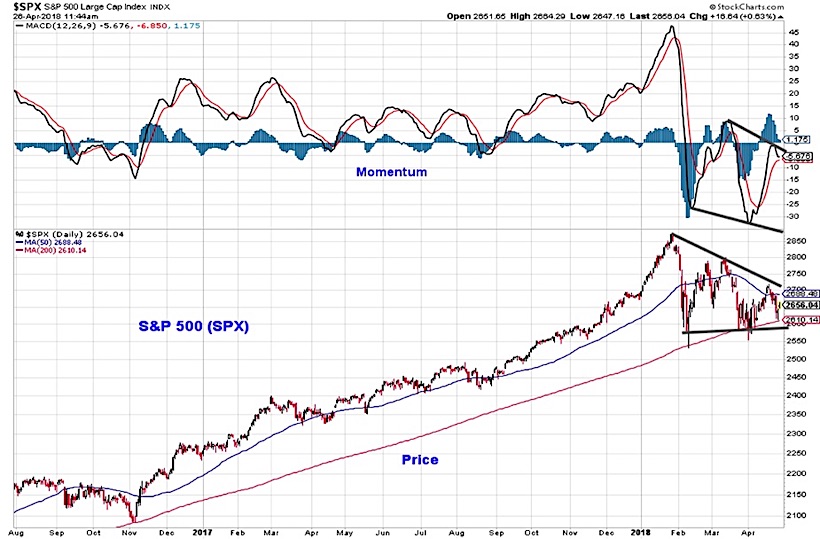
The April rally carried the S&P 500 from support at its 200-day average to resistance just above the 50-day average, keeping intact the pattern of lower highs that has emerged since January. While from a price perspective the S&P 500 did not, on a daily basis, undercut its February low, the momentum line did make a lower low and has joined the price line by making a lower high in April. Other indexes show similar patterns.
The small-cap Russell 2000 has seen lower highs for both price and momentum, although it is also seeing higher lows as well. The NASDAQ Composite made a new high from a price perspective in March, although its April peak failed to re-capture even its January high. Momentum for the NASDAQ Composite has continued to make lower highs and lower lows. With the move off of early April lows having stalled without momentum breaking out to the upside, the period of consolidation appears to be ongoing.
With the indexes still in consolidation mode, we look to breadth indicators for evidence of improvements/deterioration beneath the surface that could support the next meaningful move in the indexes. We continue to believe that when a sustained upside breakout occurs it will be accompanied by breadth thrusts and multiple days on which upside volume on the NYSE outpaces downside volume by better than 9-to-1. Other breadth indicators can be helpful in determining if such a breakout is becoming more or less likely. The April rally came with an expansion in the percentage of S&P 500 stocks trading above their 50-day averages (encouraging but shy of being indicative of further strength).
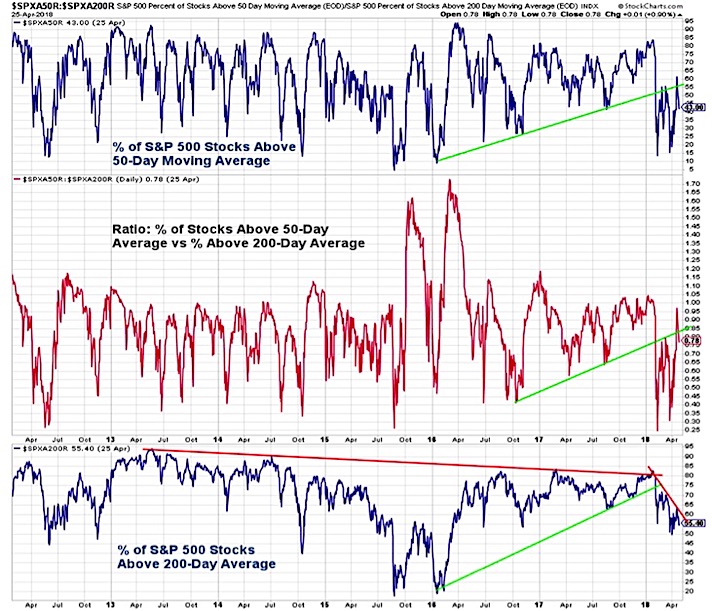
The percentage of stocks trading above their 200-day averages did not see similar improvement, remaining shy of its March peak. A break below 50% could signal a meaningful deterioration in breadth.
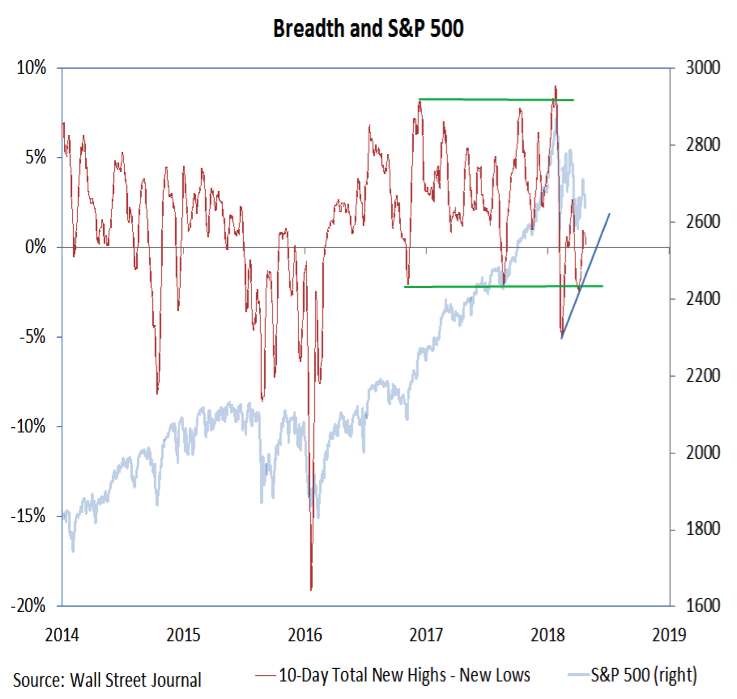
The spread between the number of issues making new highs and new lows made a higher low in March. As the April rally has stalled, however, we have seen a steady expansion in the number of issues making new lows, with new lows on both the NYSE and NASDAQ rising in each of the past six trading days. The aggregate number of new lows remains relatively small, but further expansion would represent deterioration in breadth.
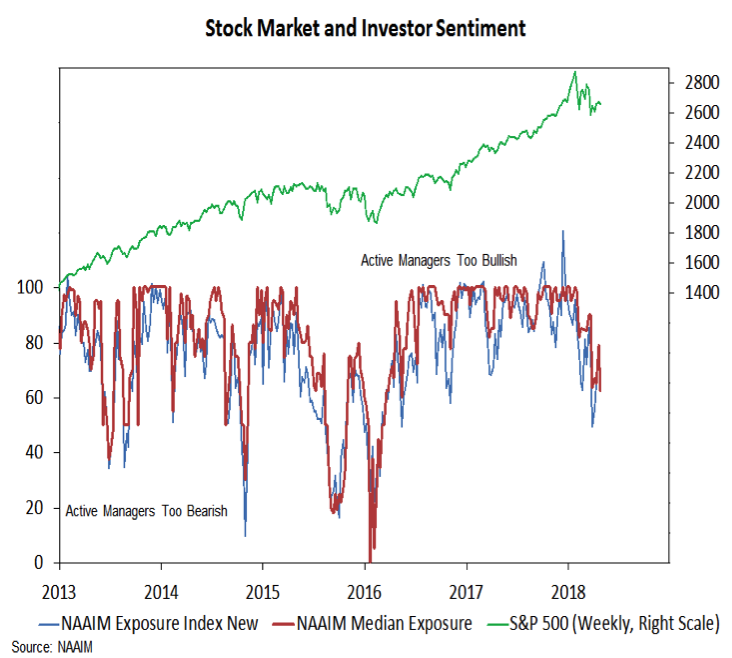
In addition to watching breadth developments, we are keeping a close eye on how investors respond. The move off of the April lows was accompanied by rising levels of investor optimism after seeing signs of excessive pessimism (as a reminder, our overall Weight of the Evidence continues to rate sentiment as a contrarian bullish indicator).
The NDR Daily Trading Sentiment Composite has moved out of the Extreme Pessimism zone and is now neutral. All of the net gains in the S&P 500 over the past 12+ years have come with this indicator showing Extreme Pessimism.
The weekly sentiment surveys are also showing less pessimism. Bears on the AAII survey of individual investors have fallen from 43% to 26% over the past two weeks. The Investors Intelligence survey of advisory services never showed much pessimism and is back to nearly 2.5 bulls for every bear (bulls this week rose to 48%).
The NAAIM data shows that relative to the last two years, optimism has been fully unwound. From a historical perspective, however, an exposure index (and median exposure) in the 60s is hardly evidence of bearishness. If the broad market does not see further deterioration, we have likely seen a sufficient unwinding in optimism. If breadth takes another leg lower, we might need to see pessimism move to more historically consistent extremes.
Twitter: @WillieDelwiche
Any opinions expressed herein are solely those of the author, and do not in any way represent the views or opinions of any other person or entity.

 and Semiconductors (SMH)")
 Make A Higher Low?")


 Make A Higher Low?")
")