The U.S. stock market indexes are in the midst of a pullback.
The S&P 500 (NYSEARCA:SPY) should see a bit more downside pressure before a bounce ensues.
S&P 500 Cycle Outlook for the Week of September 10, 2018:
– The stock market fell last week, with the S&P 500 (SPX) down 30 points to 2872, a decline of 1%.
– The technology sector showed particular weakness, as the government indicated an increasing desire to scrutinize social media firms.
Our projection is for this period of risk to continue, with the SPX declining to around 2846.
“Market Week” Outlook Video
Stocks continued the pullback that began during the previous week. In fact, technology stocks were hit particularly hard, with the Nasdaq (NDX) falling nearly 3%, but large caps also face risk as the trade war continues, as I pointed out in the latest Market Week show.
The technology risk manifested as social media executives Sheryl Sandberg of Facebook (FB) and Jack Dorsey of Twitter (TWTR) testified before Congress. This occurred as Attorney General Jeff Sessions announced his intention to further discuss allegations that social media firms are biased against conservatives.
Later in the week, the government reported the trade deficit had hit $291 billion for the first half of 2018. This is the highest deficit since 2008. As such, Trump indicated he was ready to proceed in implementing $267 billion in Chinese tariffs. Stocks slumped on the news.
Looking at the macro picture, three countries including China missed expectations for their latest Purchasing Managers Index (PMI) readings. This occurred as the US exceeded expectations for its own PMI, as well as expectations for job creation and wages.
However this increased the likelihood that the Fed would continue to increase interest rates. As such, the dollar index was up 0.3% on the week, while emerging market currencies continued to sink. For the week, the South African Rand dropped 4%, Indonesian Rupiah fell 1%, while the Turkish Lira rose 2%. The MSCI Emerging Markets Index (EEM) sank nearly 4%.
S&P 500 (SPX) Daily Chart
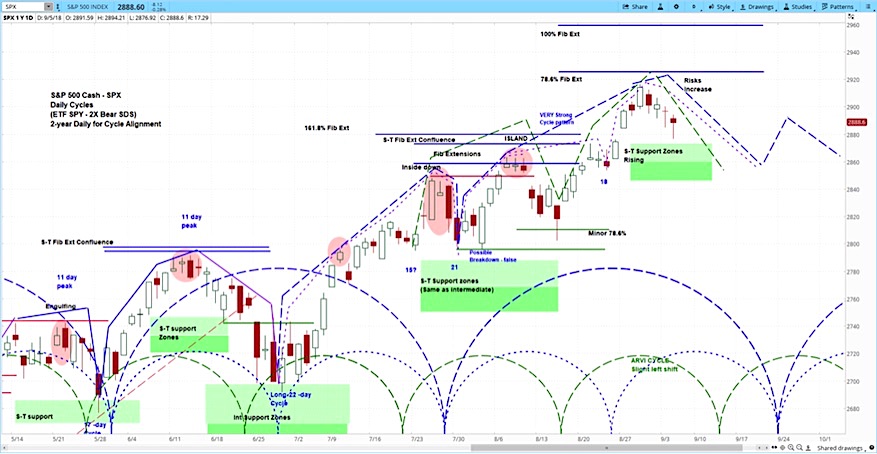
Our analysis of the S&P 500 (SPX) is for stocks to continue to roll over. Last week, the SPX fell into our support zone, of which the bottom is 2846. While we still see that support holding, our question is how long the period of risk will continue.
Our first near-term projection is shown by the green cycle in the chart above, which views the declining phase as lasting until the middle of next week. The other near-term projection is shown by the blue cycle, shows the risk lasting until later in September.
While we believe the near-term will bring some choppiness, intermediate patterns suggest more risk coming in October and November.
Twitter: @askslim
Any opinions expressed herein are solely those of the author, and do not in any way represent the views or opinions of any other person or entity.


: Showing Some Signs of Emerging Strength")
