In this week’s investing research outlook, we analyze current trends for the S&P 500 Index (INDEXSP:.INX), while checking in on stock market indicators such as sentiment and breadth. We’ll also discuss current investing themes and news that we are watching in the financial markets.
Here’s our summary of our findings for the week ending December 22, 2017:
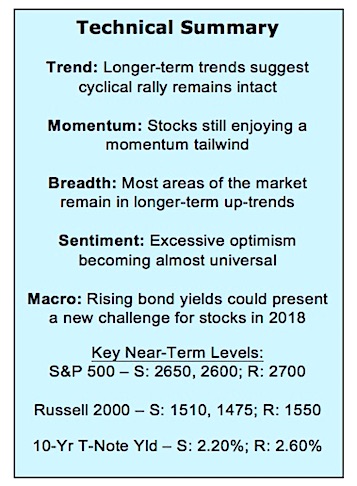
Path Of Least Resistance Remains Higher – The cyclical trend that emerged off of the early 2016 lows remains intact and the path of least resistance for stocks remains higher. Breadth is generally supportive and new index-level highs have been accompanied by improving momentum.
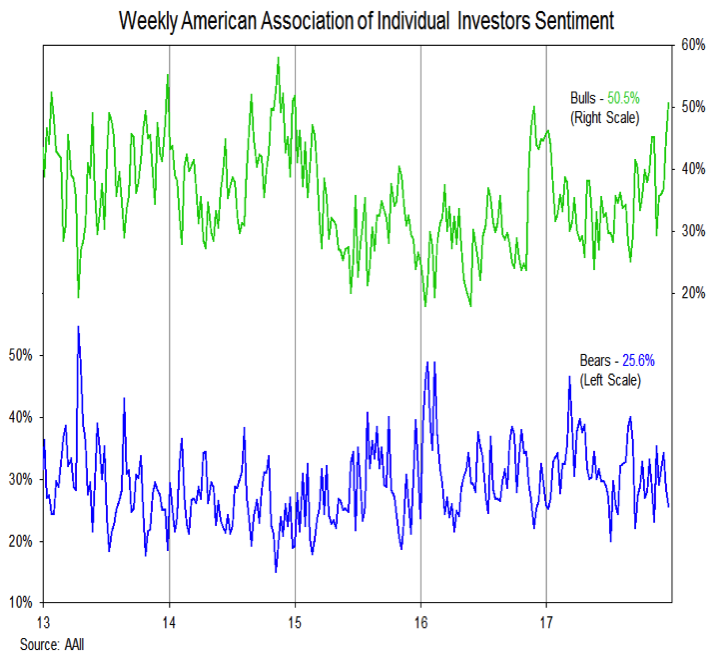
Individual Investors Turning More Optimistic – Pockets of optimism have been present in the market all year long, but with the recent increase in bulls on the AAII survey of individual investors, it appears the excessive optimism is becoming more universal. This alone may not disrupt the underlying trend in stocks, but could contribute to a bumpier ride in 2018.
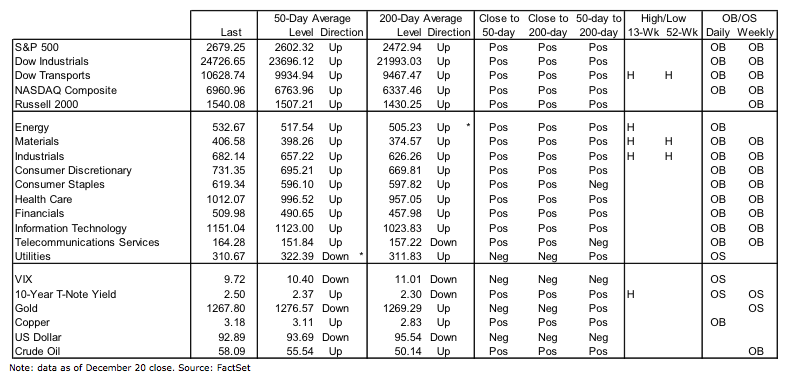
Bond Yields Heading Higher – Bond yields in both the U.S. and Germany have moved off of their recent lows, with the 10-year T-Note yield moving towards its early-year peak above 2.60%. This move higher in yields has been echoed by a bounce in copper prices. With economic growth accelerating and central banks becoming less friendly, this could be the beginning of a more protracted move higher in yields.
Stock Market Indicators
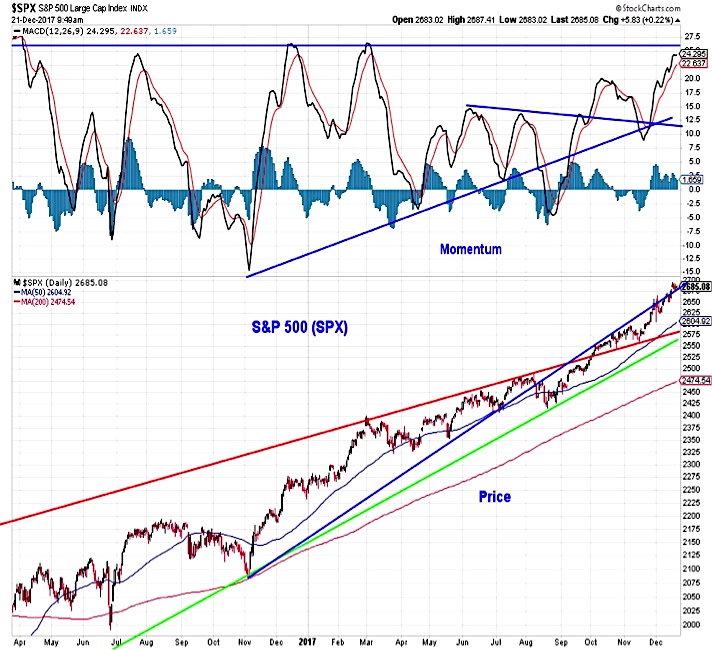
S&P 500 Index
The path of least resistance for stocks remains higher, with both price and momentum trends for the S&P 500 rising. One minor caveat is that momentum is approaching the peak levels seen over the course of the past two years. If momentum cools and prices re-trench, look for support beginning near 2600. This may be more of story for 2018, however, as the allure of reaching 2700 by year-end could be hard to resist.
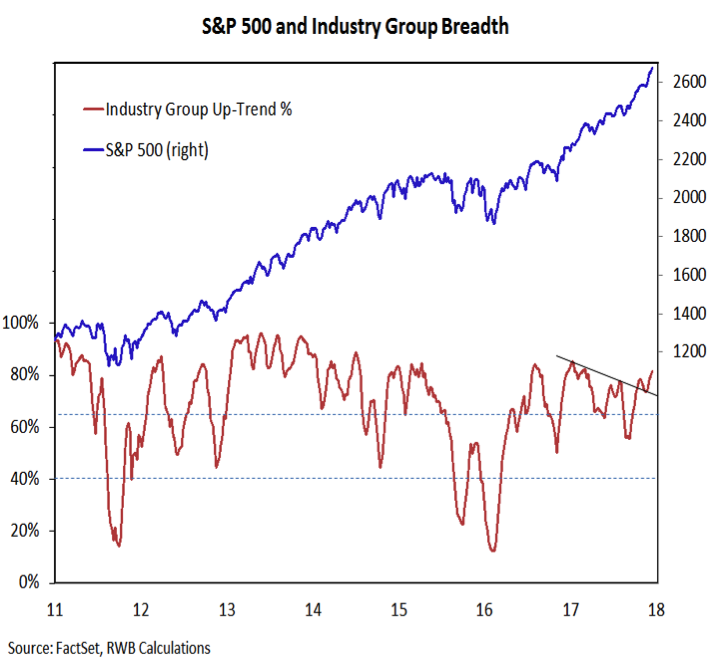
Breadth has been bullish all year, even as some deterioration was seen. More recently, however, the percentage of industry groups in up-trends has expanded. The cyclical rally in the popular averages continues to be supported by sector-, industry group-, and issue-level trend indicators.
Investor Sentiment
The latest data from the AAII shows that individual investors have turned more optimistic. Bulls have surged from below 30% in mid-November to above 50% this week. This is the most bulls since late-2014/early-2015. Bears have fallen in recent weeks, but remain below the trough readings that occurred earlier in 2017.
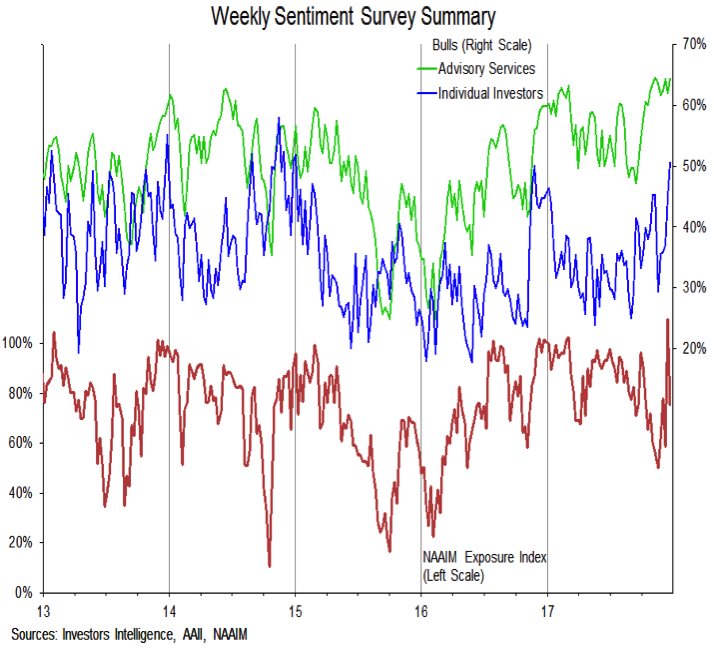
New-found optimism among individual investors matches what is seen on most other surveys of investor sentiment. Advisory services bulls have been above 60% for two months, and the NAAIM Exposure Index, which measures equity exposure among active investment managers, surged to its highest level on record last week (before giving some back this week). Optimism tends to run high heading into year-end, and with the stock market performance of 2017 there is little reason to expect this year to be different. A better gauge of sentiment could be what happens with investor psychology if/when volatility picks up next year.
Will overly bullish sentiment produce a stock market top? Let’s look at some other fundamental and technical indicators.
continue reading on the next page…


