Stocks slid yesterday and the rally may face additional headwinds going forward.
Here’s our latest look at key technical indicators and market trends for the trading week ending April 20, 2018.
Key Takeaways: A pessimism-fueled bounce has led to some near-term breadth improvements. Lack of a breadth thrust and more challenging tone from longer-term breadth trends suggest continued caution remains warranted. Near-term path for stocks could get rockier as optimism returns and with bond yields and commodities moving to new highs.
Stocks Bounce but Breadth Inconclusive as Near-Term Headwinds Build
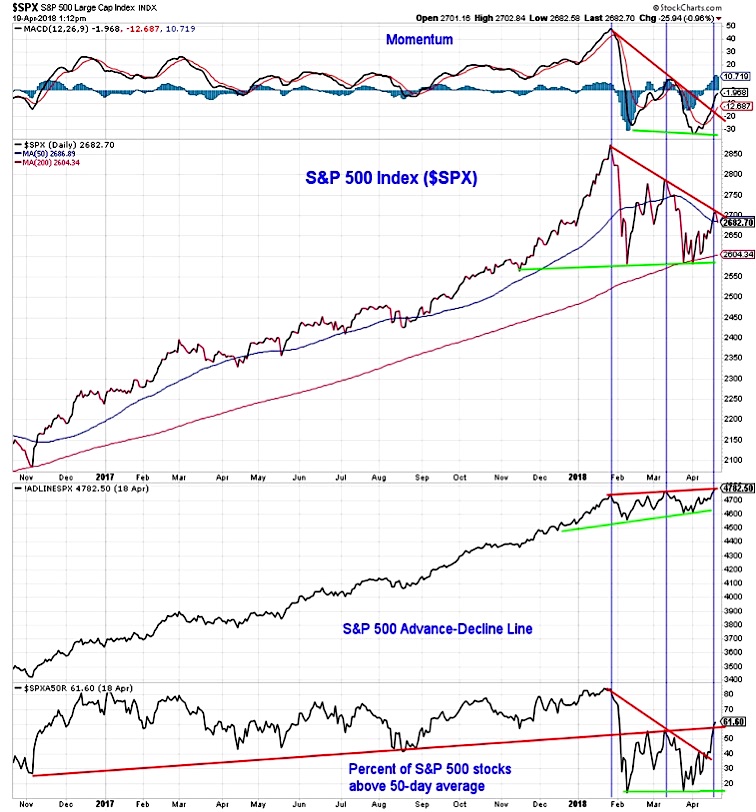
Fueled by a build-up in short-term pessimism, the S&P 500 has been in rally mode since the recent test of its 200-day moving average. This rally has carried the index above its 50-day moving average and a test of the down-tend that has formed off of the January and March peaks. This rally has seen an expansion in the percentage of stocks trading above their 50-day average (at 61%, it is at its highest since February) and has included a new high in the S&P 500 advance-decline line. While the improvement in the near-term breadth backdrop is encouraging, we would caution against making too much of it.
Both the January and March pullbacks in the S&P 500 coincided with new highs in the advance-decline line (i.e., breadth did not lead the index), index level momentum is shy of its March peak (after making a lower low earlier this month), and the longer-term breadth backdrop argues for caution.
While selling pressure has perhaps ebbed, we are still lacking evidence that broad market momentum has turned more constructive. Since the January market peak, we have seen (by our count) six trading days where downside volume outpace upside volume by more than nine-to-one. We have yet to record even a single day when upside volume has outpaced downside volume by a similar margin. We are also watching for evidence of historically meaningful breadth thrusts. These could be a surge in the 10-day advance/decline ratio and, as shown here, a significant expansion in the percentage of stocks trading above their 10-day averages. These would be signals from the broad market that upside momentum is buliding.
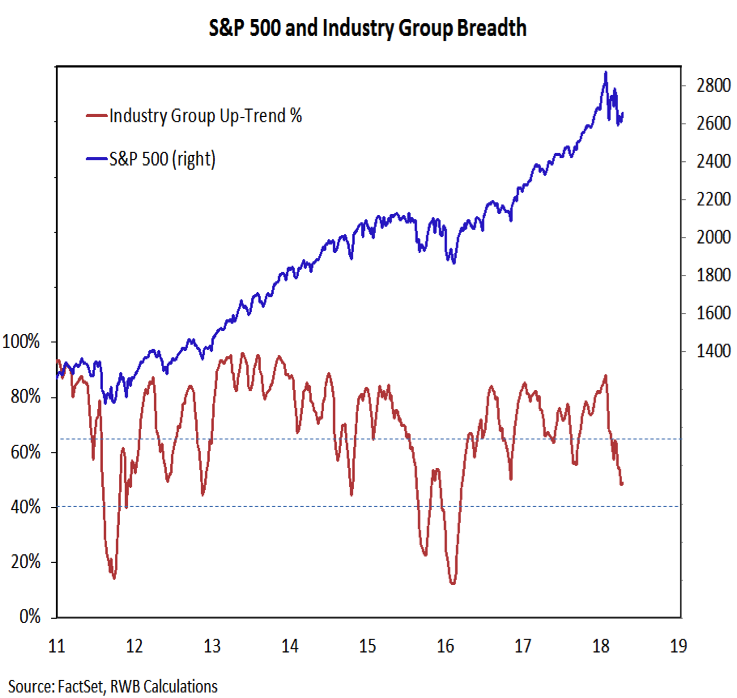
We also have a close eye on our indicator that provides a gauge of industry group strength. This indicator has shown steady deterioration in 2018, and currently has just 48% of the industry groups in the S&P 1500 in up-trends. This is below the November 2016 trough and continued readings below 50% would be consistent with a more drawn out cyclical correction. Given the index-level rally over the past two weeks, it will be important to see this indicator move off its recent lows to prevent sending a bearish divergence message.
The near-term path for stocks could get rockier. Neither broad-market nor index-level momentum is providing fuel for the rally. Stocks are no-longer oversold on a short-term basis, and there is evidence that near-term investor pessimism is dissipating (the AAII survey shows the most bulls since February and the NAAIM Exposure index has risen from 49% to 78% over the past three weeks). The NDR trading sentiment composite has moved out of the excessive pessimism zone and is climbing toward optimism.
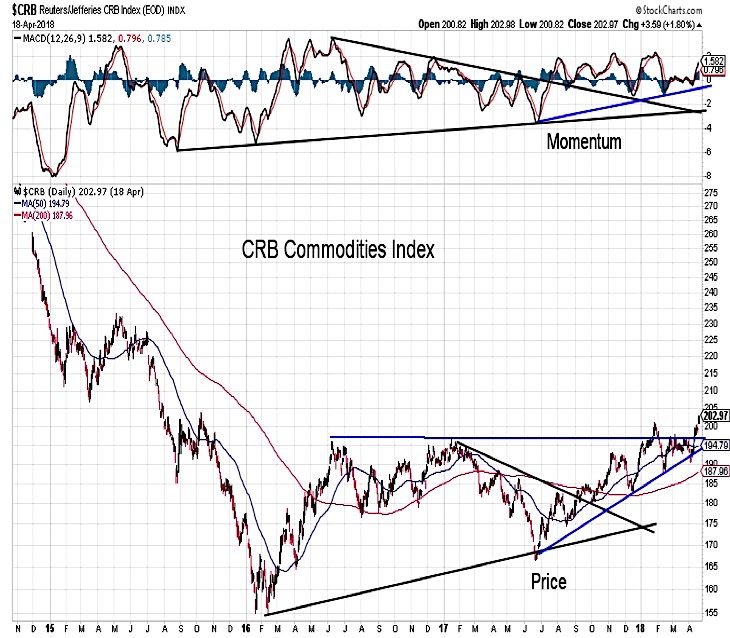
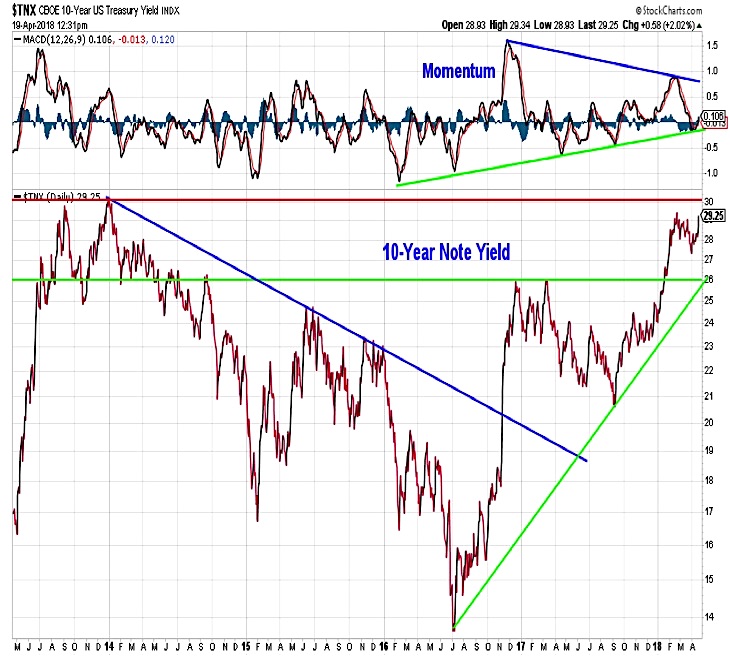
In addition to that, commodities are breaking out to the upside and bond yields are testing their early-year peak. This could move yields, relative to their trend, back into a zone where stocks have historically struggled. The moves in bonds and commodities come with supportive momentum trends and could be indications that inflation pressures are building and the Fed may have to accelerate its path of interest rate hikes.
The Bottom Line is that the S&P 500 has rallied toward resistance, but we see little evidence that this is the first leg in a meaningful move higher for stocks.
Thanks for reading.
Twitter: @WillieDelwiche
Any opinions expressed herein are solely those of the author, and do not in any way represent the views or opinions of any other person or entity.

: Showing Some Signs of Emerging Strength")
