Weekly Market Outlook & Technical Review – February 10th
In this research note, we will look at some key stock market indicators, the health of the S&P 500 Index (INDEXSP:.INX), and a handful of emerging themes that we are watching in our investing research:
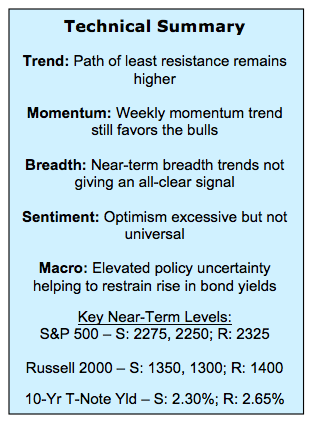
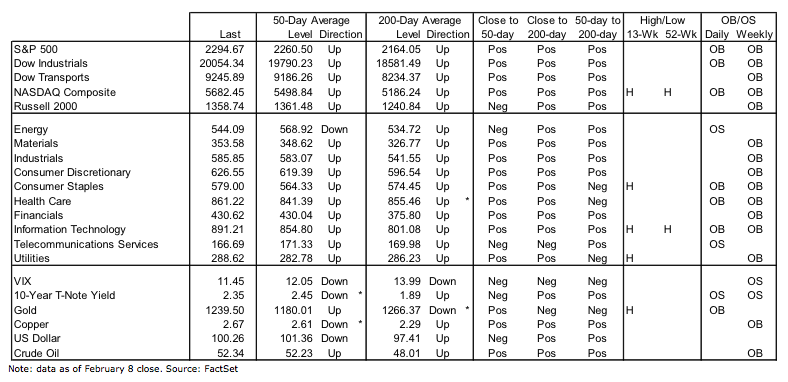
Indexes Making New Highs – The S&P 500 has broken out to a new all-time high, and is joined in record territory by the Dow Industrials and the NASDAQ Composite. Small-caps and mid-caps are still lagging, but are not too far from new highs of their own. While the path of least resistance appears to be higher, an acceleration in the uptrend is not likely without improving near-term breadth trends.
Stocks and Sectors Not Confirming Breakout – Longer-term breadth trends remain favorable and an overwhelming majority of industry groups are in up-trends. The near-term breadth picture is cloudier. The percentage of stocks trading above their-50-day and 200-day averages is off its recent highs and sector-level price, breadth and momentum trends are not confirming the strength seen at the index level.
Surveys Still Showing Optimism – This week’s Investors Intelligence data showed the most bulls in over a decade and the fewest bears since just prior to the market peak in 2015. While we certainly see this as a risk factor, history shows that optimism can stay elevated at excessive levels for extended periods of time.
Stock Market Indicators
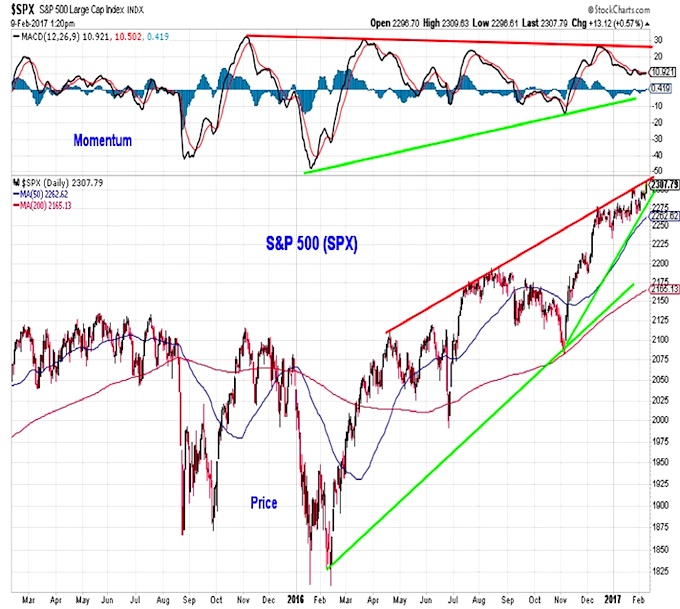
S&P 500
The S&P 500 has moved to a new high, but it has been more of a drift higher rather than a surge higher. As such, momentum has not expanded and the trend line that has been offering resistance continues to do so.
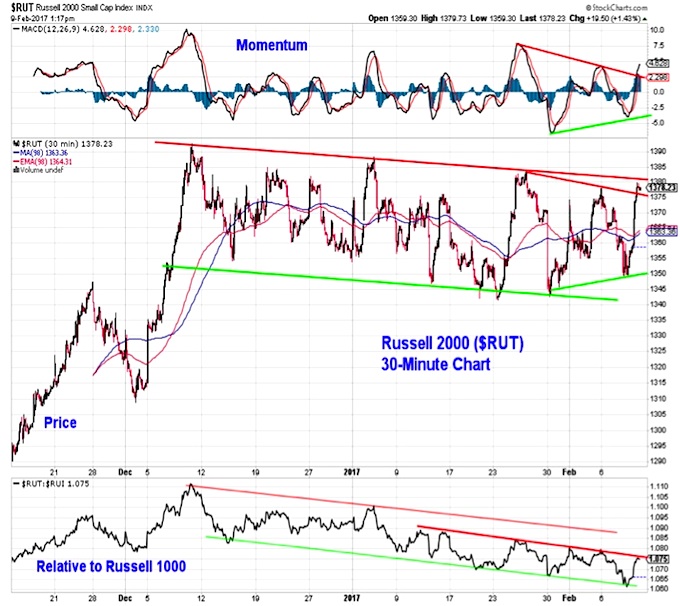
Russell 2000
While the S&P 500 has been drifting higher, the small-cap Russell 2000 (INDEXRUSSELL:RUT) has been drifting largely sideways (with a modest downward bias). As such, small-caps have lost ground relative to large-caps over the past two months. On a short-term basis, momentum for the Russell 2000 has swung higher and after failing to fully test support (i.e., after making a higher low), the Russell 2000 is now challenging resistance.
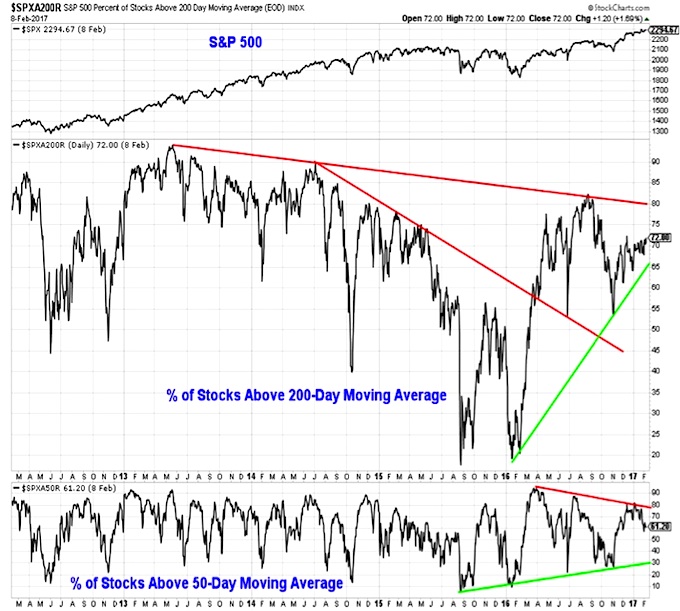
S&P 500 – Market Breadth
While the S&P 500 has moved to a new high, rally participation at the individual stock level has lagged. The percentage of stocks trading above their 200-day averages remains below the mid-2016 peak near 80% (currently close to 72%). The percentage of stocks trading above their 50-day averages was near 80% in December but is now closer to 60%. While keeping an eye on these divergences it is important to note that they can resolve themselves (in a bullish fashion) quite quickly, especially when the overall breadth back-drop remains bullish.
continue reading on the next page…


