The stock market rose last week, with the S&P 500 (NYSEARCA: SPY) rallying 58 points to 2781, an increase of 2.1%.
Now bulls and bears are in gridlock… not to dissimilar to the results of the mid-term elections.
Gridlock good for stocks?
Traders liked the result of the US elections that split control of Congress between the Republican and Democratic parties.
But market cycles indicate headwinds / challenges ahead.
Our projection is for choppy price action this week in the S&P 500, with a possible dip to 2734.
S&P 500 Market Cycle Outlook for the Week of November 12, 2018:
Stocks had strong gains last week, as the post-election rally turned into a buying panic, as I pointed out in the latest Market Week show. In fact, traders were buying like it was late-2016 all over again.
The midterm elections handed control of the House of Representatives to the Democratic party, which ensured a divided government for the coming two years. While this was a blow to the Trump administration, it is notable that it could have been worse had the so called “blue wave” also given control of the Senate to the Democrats.
During the Federal Reserve’s meeting last week, it decided to keep rates unchanged, The governors noted a decrease in the unemployment rate, as well as a moderation in fixed asset investment. Notably, they did not comment on October’s stock market volatility.
In Asia, the China 25 Index (FXI) declined by nearly 3% on Friday. This occurred after its central bank recognized the strength of the downward pressures with which the economy is grappling. Meanwhile, Japan’s top central banker Haruhiko Kuroda conceded that, “large-scale monetary easing is no longer the best policy.”
Beyond this, crude oil fell every day last week, declining by over 4% which was its fifth consecutive week of declines. This was due in part to news that a top Saudi think tank was studying the impact of a potential breakup of OPEC. In the Market Week show, we analyze how market cycles affect crude oil’s price action.
S&P 500 (SPX) Daily Chart
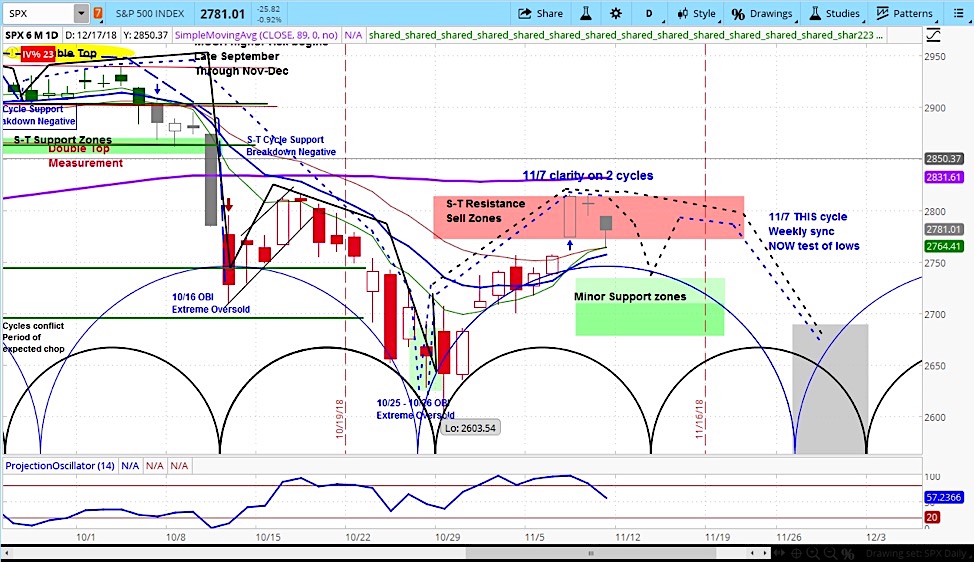
Our approach to technical analysis uses market cycles to project price action. Our analysis of the S&P 500 is for continued choppy movement, within the context of its current minor cycle, as shown on the chart above. Our downside target is 2734.
For more from Slim, or to learn about cycle analysis, check out the askSlim Market Week show every Friday on our YouTube channel.
Twitter: @askslim
Any opinions expressed herein are solely those of the author, and do not in any way represent the views or opinions of any other person or entity.


: Showing Some Signs of Emerging Strength")
