The past several weeks have been an adventure for active investors. To be honest, I’ve been itching to be more active, but my experience has told me that sometimes less is more.
Earlier this week I highlighted a major S&P 500 Fibonacci extension level that resides just overhead around 2140. This area coupled with some other near-term fibs makes 2130-2160 interesting. But when and how we get there is another story.
At the same time, it also offers perspective: that price zone is not much higher than where the S&P 500 is currently trading. I also offered this nugget on the price action in 2015:
It’s inevitable, every time investors start to “look” higher, the market reverses and punishes them.
This could change next week or next month, but this is what it’s been like thus far.
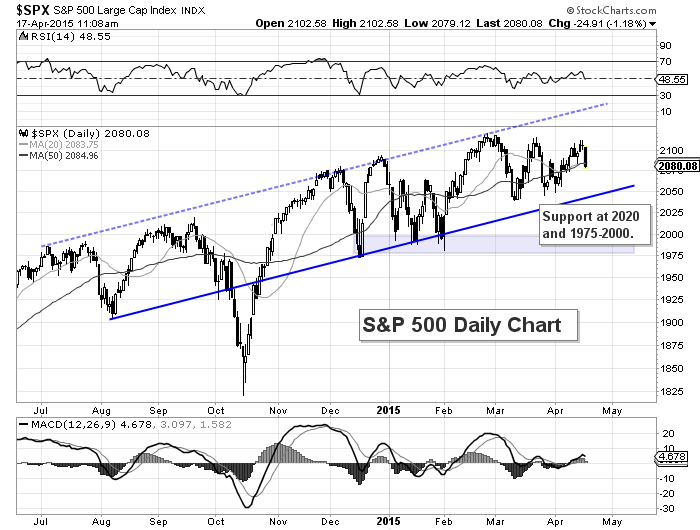
So what’s going on? If we look at the one year chart of the S&P 500, we can see that it is still trading within a channel but momentum has slowed. The major index is trying to correct through time rather than price, currently sitting at the same price it was at in late November. All in all, consolidation isn’t a bad thing, especially if/when momentum re-groups.
Today, the price action has dipped below the 20 and 50 day moving averages. If the market doesn’t recover soon, lower price supports will come into view. Two lower supports to keep on your radar (if we head lower) include the open gap around 2020, and a the 1975-2000 level which includes the December/January lows.
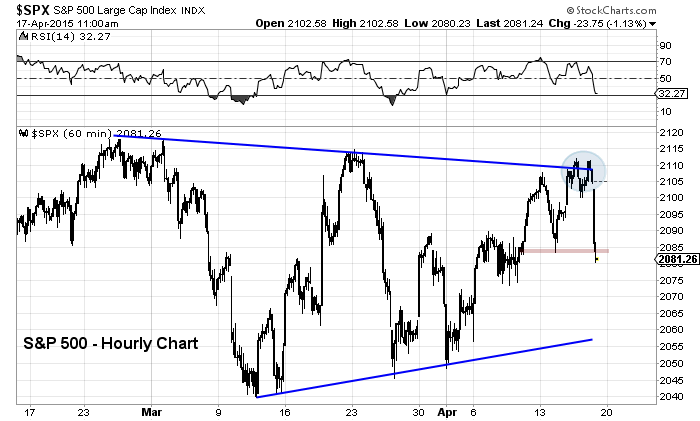
Now let’s zoom in a bit. In the chart below, you can see that a major wedge pattern has developed. As the S&P 500 “pinged” off the upper resistance line earlier this week (shaded in blue), I posted this on Twitter:
$SPX – S&P 500 awaiting “clean” break. To be, or not to be… pic.twitter.com/4Zwz0AqaO3
— Andy Nyquist (@andrewnyquist) April 15, 2015
Failure to break out above the blue resistance line triggered some selling (again). And note that today’s lows have taken out the lows set earlier this week, so the onus is back on the bulls to step up and buy this deep. If the selling continues, then I’ll shift my attention back to the lower wedge support.
Meanwhile, as the NYSE cumulative breadth indicator has made new highs in April, the number of S&P 500 stocks above their 50 day moving average is not faring as well. NYSE breadth usually wins out but we’ll have to continue to monitor the price action.
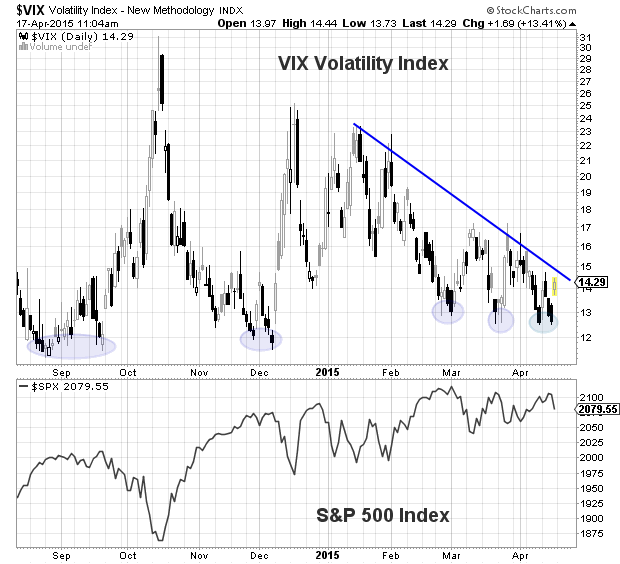
Another point of interest is the Volatility Index (VIX). Each time the market has touched down near 12 over the past 6 months, the market has pulled back. Is today’s decline more of the same? A VIX breakout above 15 would be caution and above 17 would be a warning. But it’s still too early to tell.
For now, keep an eye on that wedge. So far, it’s been like hitting out of the sand trap. Have a great weekend.
Twitter: @andrewnyquist
Author has long and short positions related to S&P 500 at the time of publication. Any opinions expressed herein are solely those of the author, and do not in any way represent the views or opinions of any other person or entity.


