 Yesterday, the markets confirmed that the markets are in a state of chop. Some could say that a smack down is in the offing, but that would only be confirmed if additional levels of support were taken out. As it stands, the markets are just over 2 percent off the all time highs. Let’s highlight some of those key technical supports on my favorite index du jour, the S&P 500.
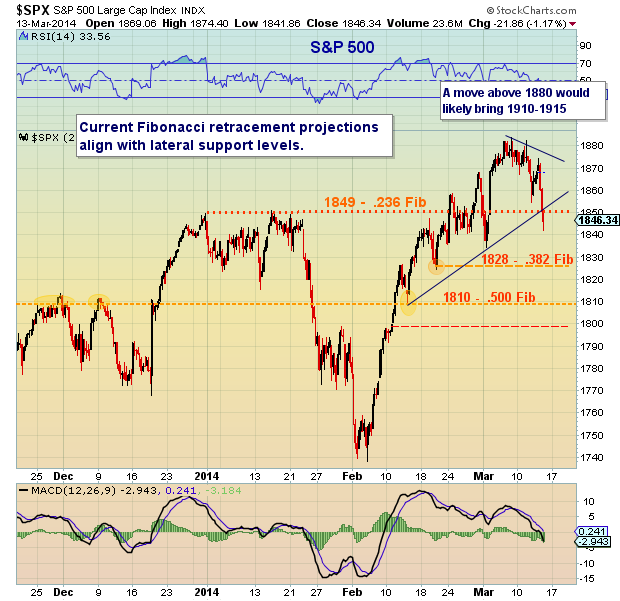
First, let’s talk about technical patterning on the daily chart. One concern is the “rounding” pattern. This often happens at short-term tops and can create a waterfall effect to the downside. Second, if we zoom out, the “skyline” over the past few months is starting to look a bit rounded. This could warn of a deeper correction if major support levels are taken out. So, what are these major supports?
1) 1849 was a heavily watched support area. Yesterday, it was taken out (bearish). The bulls would love to find a way to regain that level.
2) 1828. Although the pivot lows on March 3 (1834) are interesting, I find 1828 to be important for two reasons: It represents the .382 Fibonacci retracement and the 50 day moving average.
3) 1810. This level represents the .500 Fib. A move below 1810 would likely bring the price action below 1800.
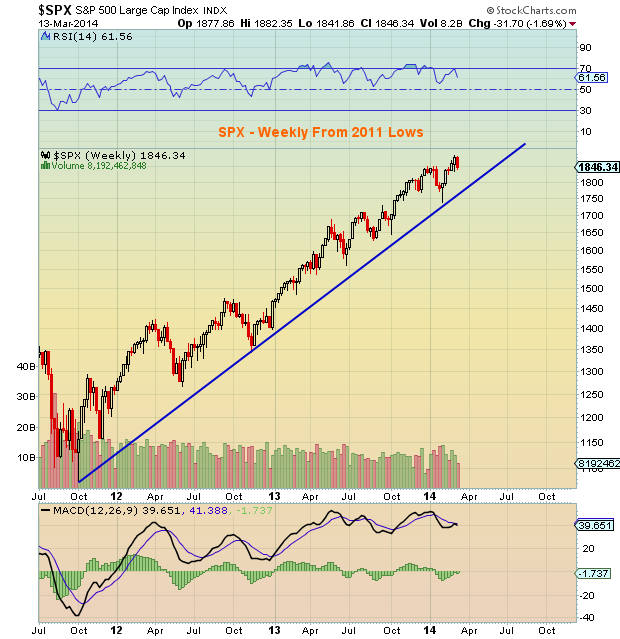
Turning to the weekly chart, we get a trend perspective. If we dip below the .500 Fib, perhaps the .618 Fib will halt the decline, but often a deeper retracement follows. This would make 1770 an important level to watch. Trade safe.
Author holds position in S&P 500 related funds at the time of publication. Any opinions expressed herein are solely those of the author, and do not in any way represent the views or opinions of any other person or entity.


