S&P 500 Futures (2-3 Days) – Bullish – Pullbacks ended up being minor by end of day yesterday, and prices retraced nearly all the weakness to close near highs. This is a short-term positive development.
Movement up to near 2285 looks likely into January 12 before any peak. A move under 2239 would be a negative and likely lead to 2228 and possibly 2223.
Equities managed to claw back after minor pullback attempts and yet again, the S&P 500 (INDEXCBOE:SPX) is positioned to make a run towards exceeding 2269-72 on Futures charts. This move would likely help prices accelerate up to 2285-90 into next week. That said, the slowdown in market breadth given the sideways consolidation will make rallies back to new highs “sellable”.
Breadth was just fractionally negative even near yesterday’s price lows, (3/2) which saw the S&P 500 bottom out precisely where it needed to at 2254 support. While Small-cap stocks suffered, along with Financials (the latter being important given the composition in SPX) there remains a lack of true technical damage with prices sitting up near striking distance of new all-time highs. Market breadth finished far stronger on the first two trading days of this year vs yesterday’s 3/2 negative, and the ability of Healthcare to come roaring back and Technology to a small extent takes some of the negativity away from the loss in Financials.
The key development Thursday was the decline in the US Dollar Index (CURRENCY:USD) and the 10 Year US Treasury Note Yield (INDEXCBOE:TNX) simultaneously. This caused the surge in Emerging markets (EEM) and Precious metals (GLD). While these look like counter-trend moves, they do look to extend possibly another few days which would help yesterday’s minor breakout in EEM and GDX (gold miners). Gold prices look to carry a bit higher. However, weekly and monthly charts remain in very good shape for the US Dollar (DXY), so this minor pullback should represent a very attractive opportunity to buy US Dollar based ETF’s like UUP and/or consider buying ETFs which give short exposure to the Euro vs Dollar, like EUO. Charts below created on Bloomberg.
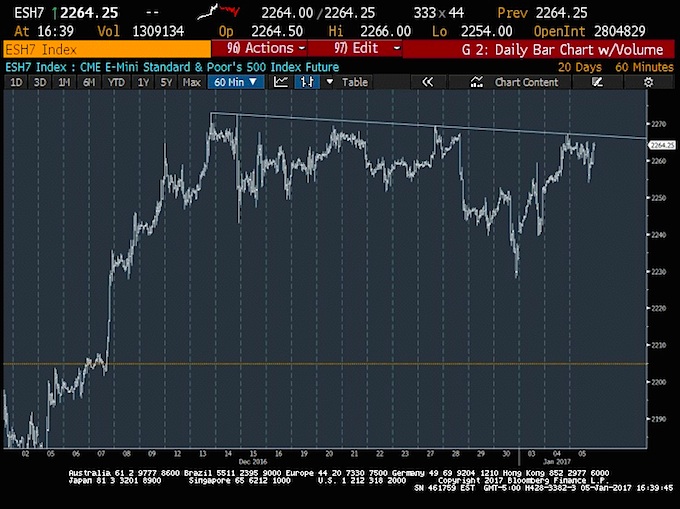
S&P 500 Futures
The S&P 500 hourly chart shows this entire range-bound/sideways pattern from mid-December which still hasn’t hardly shown any real weakness. This should be well positioned to lift up above recent highs, which could cause some acceleration in the near-term. However, sentiment has begun to reflect overly frothy levels yet again, which could mean that any breakout proves short-lived. For now, it still seems right to favor the bullish case over the days ahead.
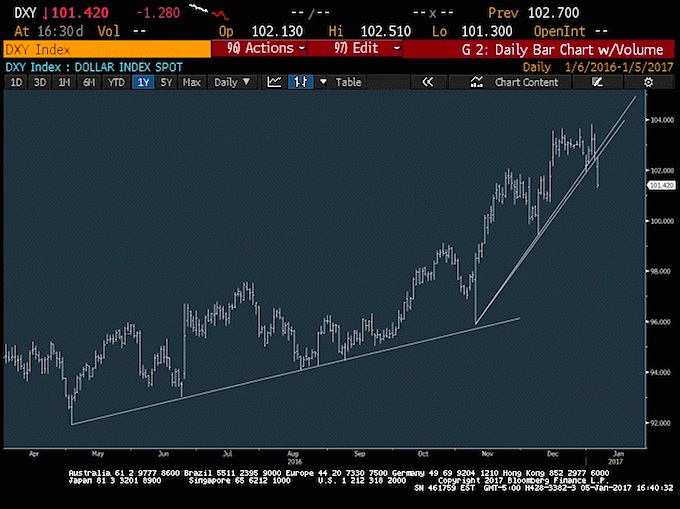
U.S. Dollar Index
This breakdown in the US Dollar (CURRENCY:USD) has been brewing for more than a month – that’s when the US Dollar index began to consolidate sideways after its runup. While Thursday’s decline in the DXY does look to have a bit more downside, the weekly and monthly charts show 100-100.50 as an excellent area to consider buying the Dollar index and/or selling Euro vs USD, thinking that the US remains in much better shape economically and should experience further Dollar strength, as the FOMCs dovish words fail to change the strengthening economic picture in the near-term.
Thanks for reading.
Note that you can catch more trading ideas and market insights over at Newton Advisor. Thanks for reading.
Twitter: @MarkNewtonCMT
Any opinions expressed herein are solely those of the author, and do not in any way represent the views or opinions of any other person or entity.


