It’s earnings season and it’s obvious. The major stock market indexes are up one day, down the next. And social media is pretty evenly split on whether the bull market has ran out of steam or not.
So let’s take a look at a chart of the broad market index, the S&P 500; the price action is the best indicator I know.
In the chart below, I took a macro view and highlighted stock market pullbacks and corrections over the past 6 years. And more recently, it’s clear that any pullbacks are being bought around the (4 – 5%) area. The current market pullback from the high of 2134.72 is (4.24%).
Does that number sound familiar ? It should, see my notes on chart. click to enlarge chart
S&P 500 Index Weekly Chart (10 Year)
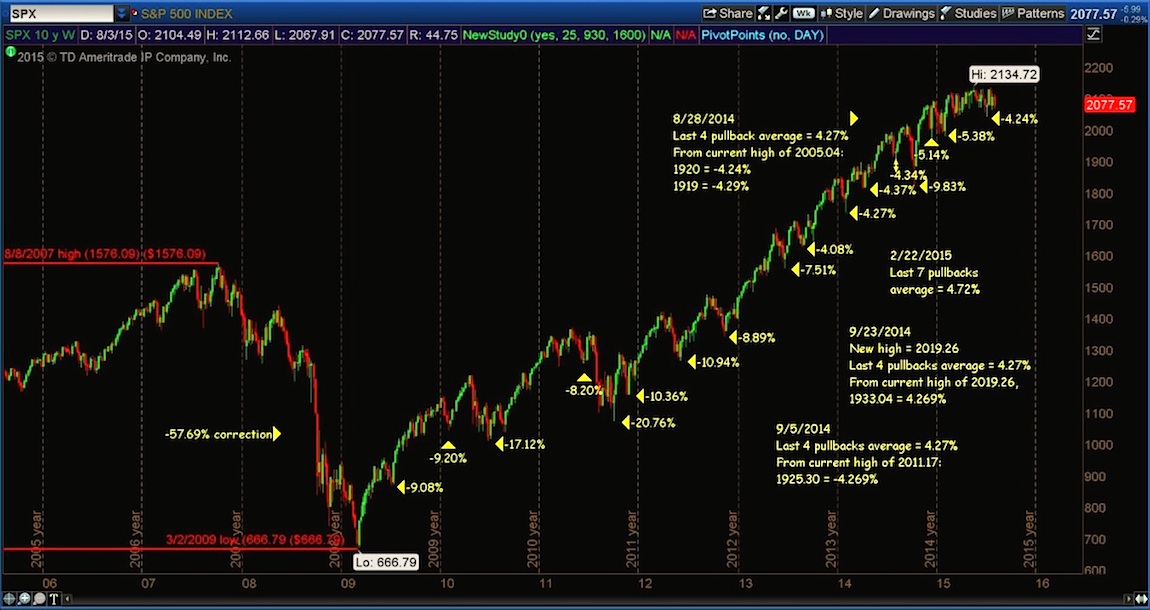
Any move beyond a 4 to 5 percent market pullback should be a warning of a change in character for stocks. Stay tuned and thanks for reading.
Twitter: @TheFibDoctor
No position in any of the mentioned securities at the time of publication. Any opinions expressed herein are solely those of the author, and do not in any way represent the views or opinions of any other person or entity.


