S&P 500 Trading Outlook (2-3 Days): Bullish
The S&P 500 Index (INDEXSP:.INX) has held the midpoint of its daily Bollinger Bands, an area that also held as support back on June 15th.
With prices literally unchanged since the market close on June 2nd, the trend has been literally been neutral and range-bound throughout all of June. That said, the last couple days of stabilization after the breakout attempt on June 19 still argue for a push to new highs into next week before any decline. My upside target is 2470-5. Unless prices move to this target, or take out 2416 beforehand, the trend remains bullish.
TECHNICAL THOUGHTS
Sector rotation continues to provide more excitement than anything the major stock market indices have shown us in the last few weeks; after three full weeks, the S&P 500 is still within a few ticks of levels it hit in early June.
While Technology provided the excitement during the month of May, for June, it’s been all Healthcare. The S&P Healthcare Index is outperforming other groups handily this month. Just in the last five trading days alone, Healthcare has been up more than 4%, while its YTD returns lag the market leading Technology group by just 200 bps. Healthcare has gotten quite stretched of late, so it’s right to use pullbacks to wait for dips to add exposure (especially given the intermediate-term breakout that’s taken place).
We’ve seen evidence in the past day or two of Crude Oil trying to ever so slowly attempt to lift higher, this while the Treasury yield curve ever so slightly attempts to steepen. Overall, we’re seeing very little net volatility in US Dollar, or Treasuries, or Equities for that matter.
While Industrials and Healthcare have been helpful in steadying the stock market indices at a time of weakness in other groups like Energy and more recently, Tech, it remains to be seen how long this rotation will last. And energy weakness doesn’t appear to be complete just yet. At present, it’s difficult to make heads or tails of this as being anything more than just sideways consolidation. But momentum remains positive along with structure on an intermediate-term basis and there is insufficient technical weakness to turn bearish yet.
Chart Spotlight: Equal Weight S&P 500 Index Relative Weakness
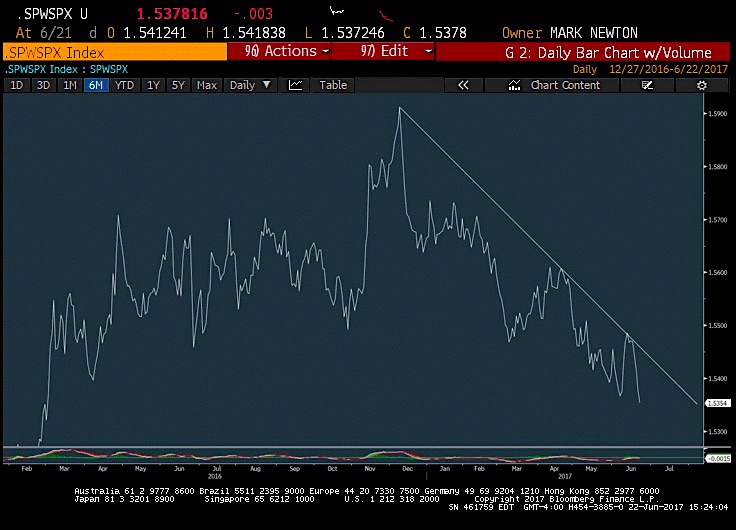
The S&P 500 has gone sideways in the last few weeks, but it’s interesting to see the Equal-Weight S&P 500 (SPW) and it’s performance in relation to it. In short, it’s been anything but stable… and lagging, to say the least. Regardless of Healthcare stepping in lately to help out, we’ve seen the S&P 500 on an equal-weight to cap weight ratio go lower ever since mid-December of last year.
This backs up the thinking of our rally being largely in a handful of stocks vs broad-based as many claim. Or put another way, the large cap strength has helped indices stay afloat as compared to equal-weight basket of all sizes being in far worse shape.
If you are an institutional investor and have an interest in seeing timely intra-day market updates on my private twitter feed, please follow @NewtonAdvisors. Also, feel free to send me an email at info@newtonadvisor.com regarding how my Technical work can add alpha to your portfolio management process. Thanks for reading.
Twitter: @MarkNewtonCMT
Author has positions in mentioned securities at the time of publication. Any opinions expressed herein are solely those of the author, and do not in any way represent the views or opinions of any other person or entity.
 Rolling Over At Key Fibonacci Level?")


 Rolling Over At Key Fibonacci Level?")