Stock Market Outlook for March 12, 2018
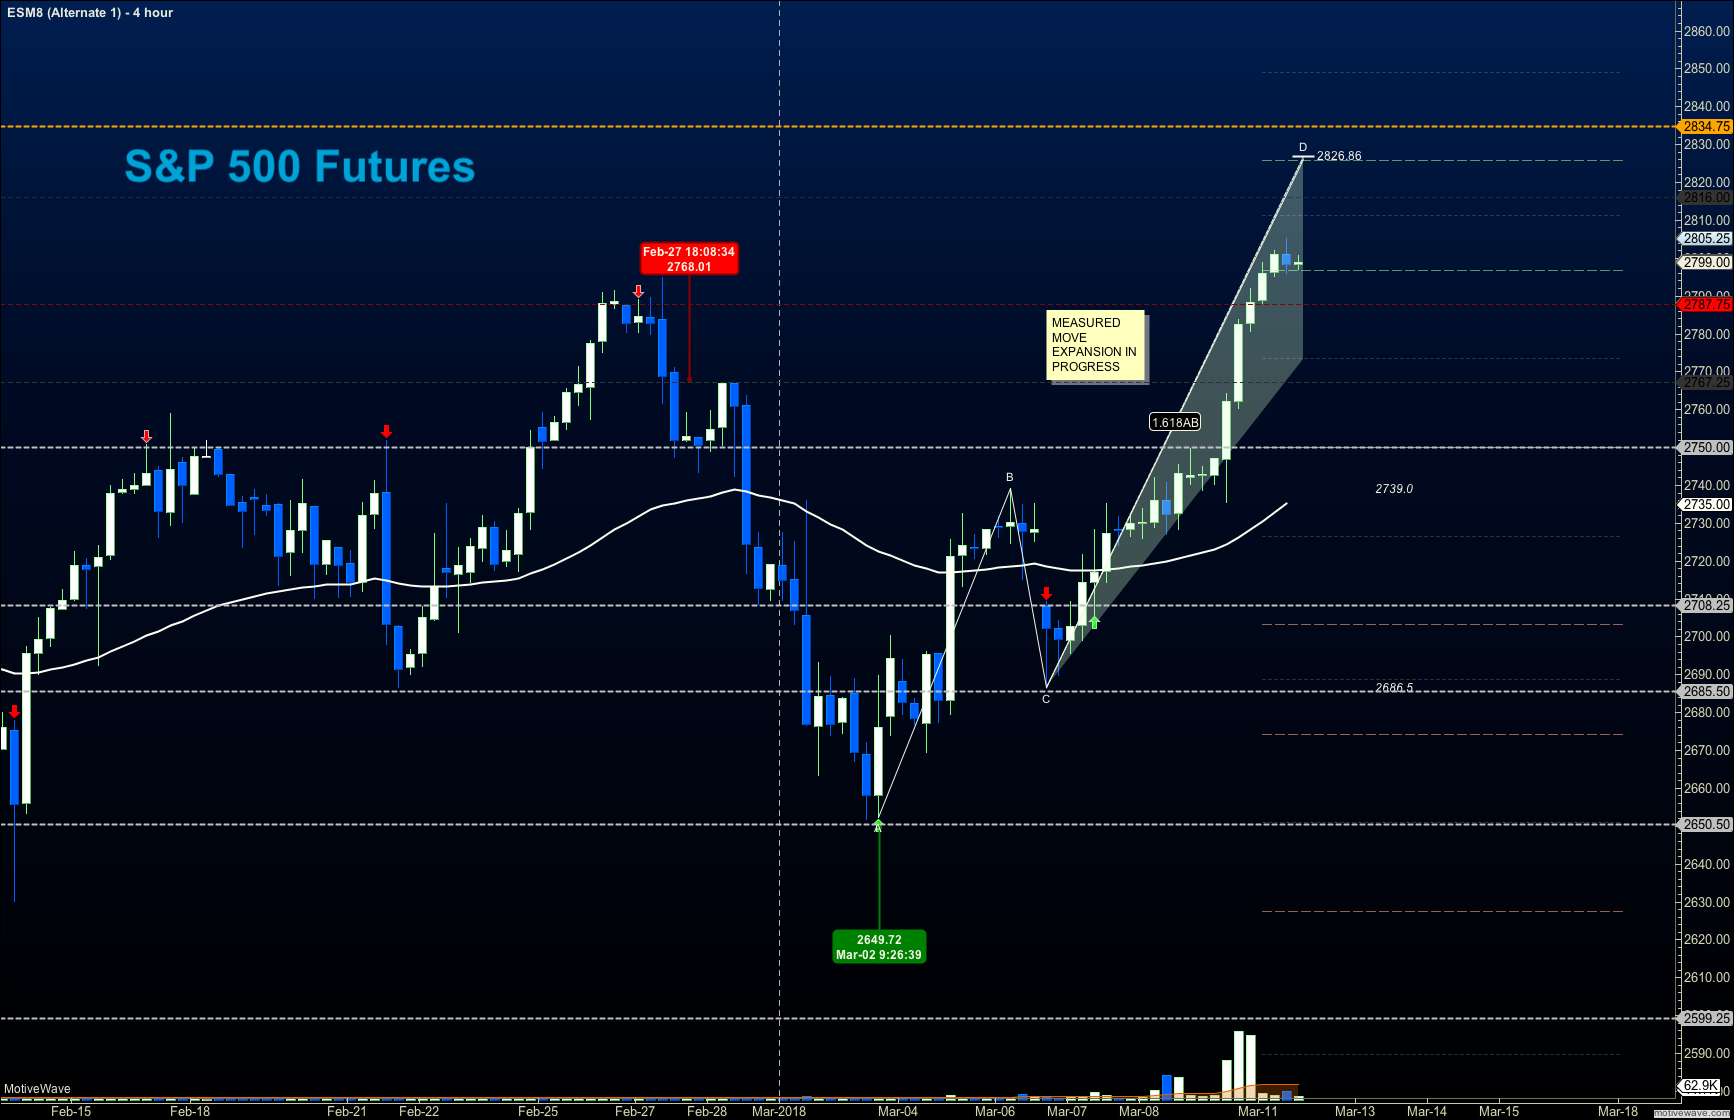
Bullish formations are prevailing this morning with buyers still holding the breakouts from Friday.
We are likely to see the same sort of trading pattern (as last week) develop today: a dip before another bounce upward. And those dips could be fairly shallow. Strong employment numbers have kept us quite bullish in these intraday spaces.
S&P 500 Futures
Resistance sits near 2805.5 today- above that, we see 2834.5 with another pause near 2814 or so. Failure to hold above 2787.75 gives sellers a chance to move into 2767, another support zone that was once resistance. Momentum is bullish but buying the highs in anticipation of even higher highs will expose the trader to greater risk events. Look for solid support to participate. The bullets below represent the likely shift of trading momentum at the positive or failed retests at the levels noted.
- Buying pressure intraday will likely strengthen with a bullish retest of 2805.75
- Selling pressure intraday will likely strengthen with a bearish retest of 2791.5
- Resistance sits near 2801.75 to 2812.5, with 2819.25 and 2834.75 above that.
- Support sits between 2793.5 and 2787.75, with 2774.25 and 2767 below that.
NASDAQ Futures
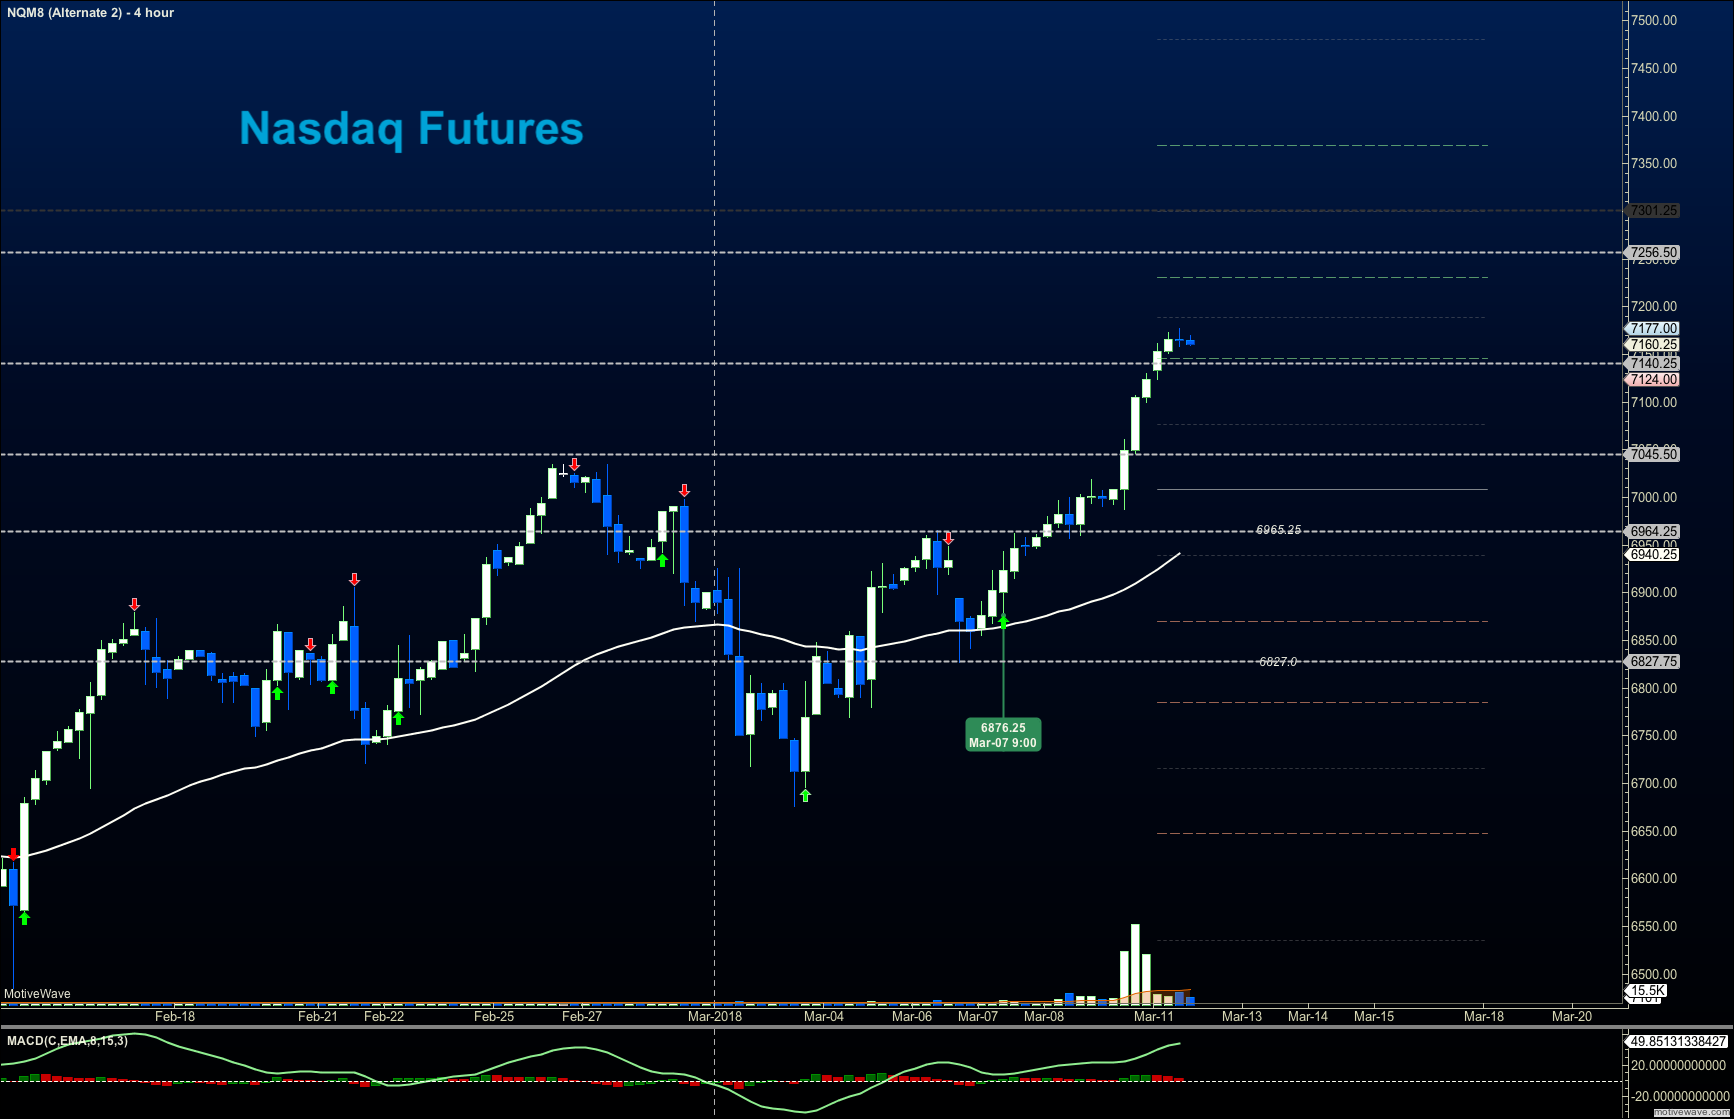
From recovery to new highs gives the NQ_F much more strength than the other indices we watch. Momentum is quite bullish and pullbacks will be buy zones for the traders. The breakout region intraday looks like 7024 (deep support for now) – with upper targets stretching to 7326 as we begin the week. The bullets below represent the likely shift of intraday trading momentum at the positive or failed tests at the levels noted.
- Buying pressure intraday will likely strengthen with a bullish retest of 7177.5
- Selling pressure intraday will likely strengthen with a bearish retest of 7147.25
- Resistance sits near 7173.75 to 7194.5 with 7235.5 and 7256.5 above that.
- Support sits between 7149.5 and 7124, with 7094.5 and 7047.75 below that.
WTI Crude Oil
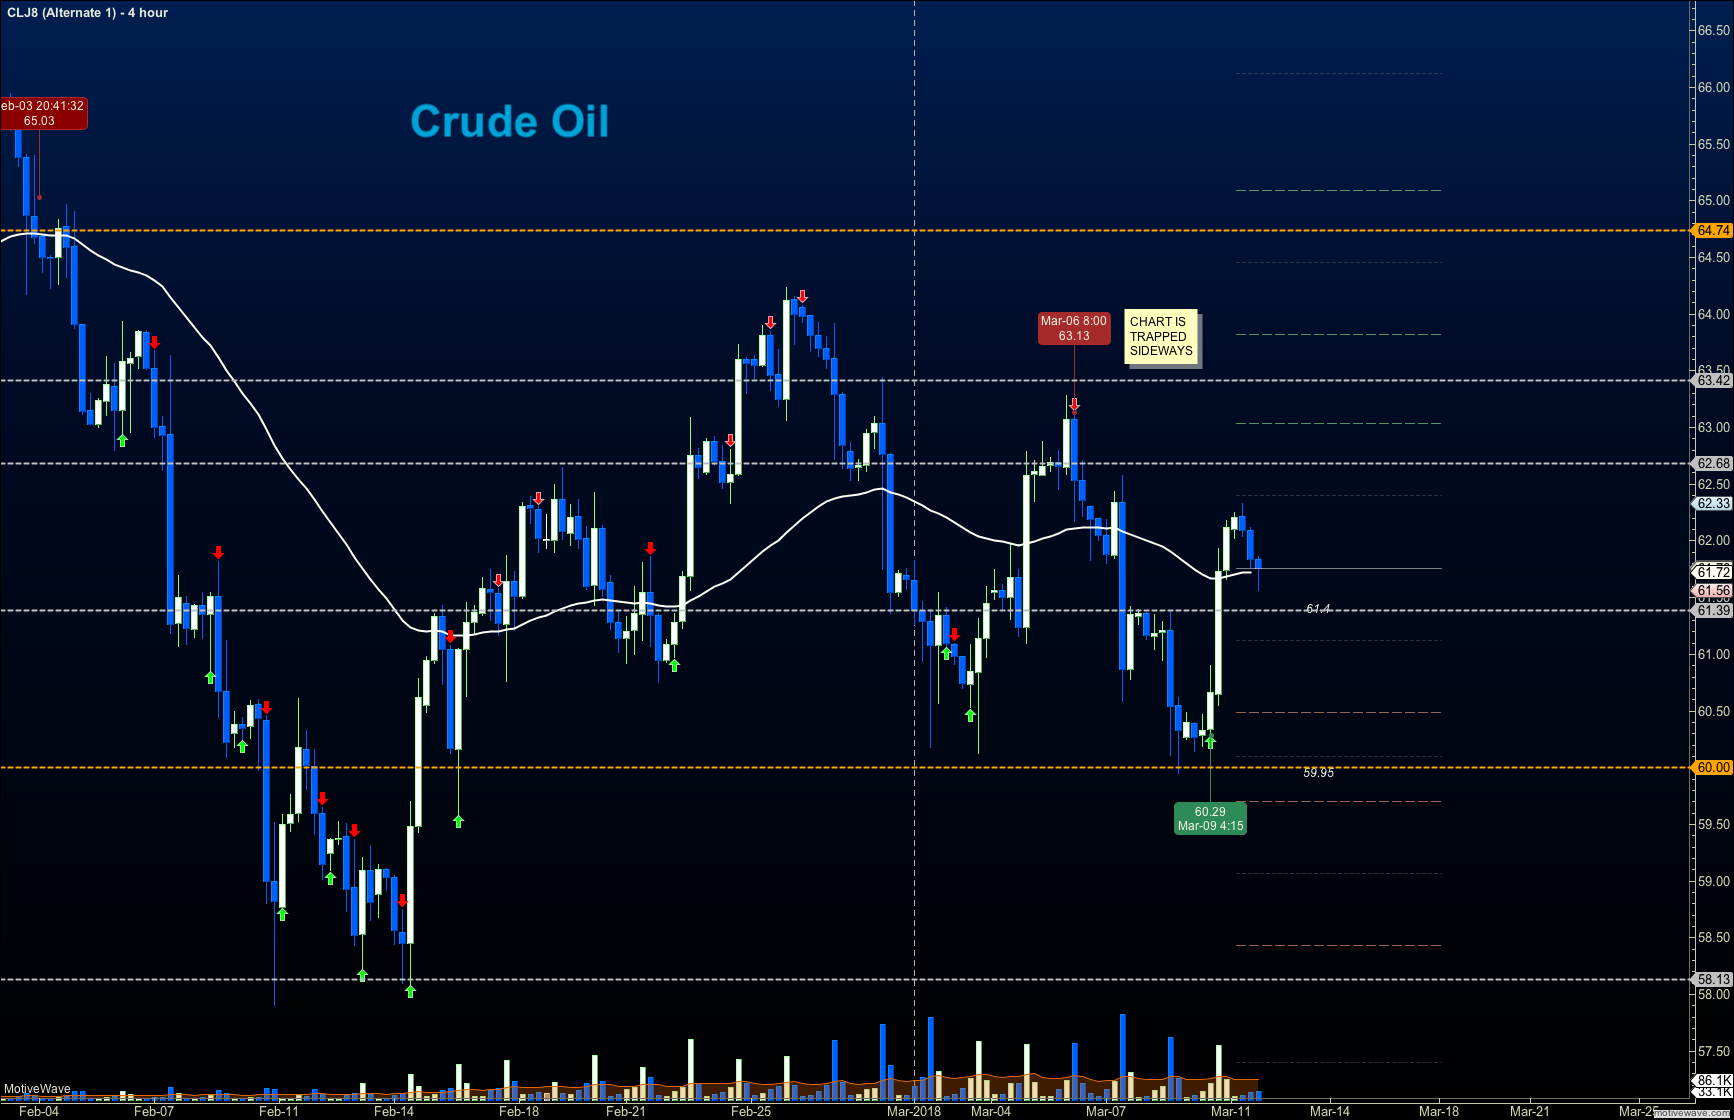
Traders are rangebound as we begin another week with movements between 60 and 64. We have failed bounces at the stretches higher but still creating lower highs in the current formation. Very messy. The bullets below represent the likely shift of intraday trading momentum at the positive or failed tests at the levels noted.
- Buying pressure intraday will likely strengthen with a bullish retest of 62.45
- Selling pressure intraday will strengthen with a bearish retest of 61.4
- Resistance sits near 62.27 to 62.64, with 63.06 and 63.85 above that.
- Support holds near 61.7 to 61.4, with 60.59 and 59.5 below that.
Twitter: @AnneMarieTrades
The author trades stock market futures every day and may have a position in mentioned securities at the time of publication. Any opinions expressed herein are solely those of the author, and do not in any way represent the views or opinions of any other person or entity.


