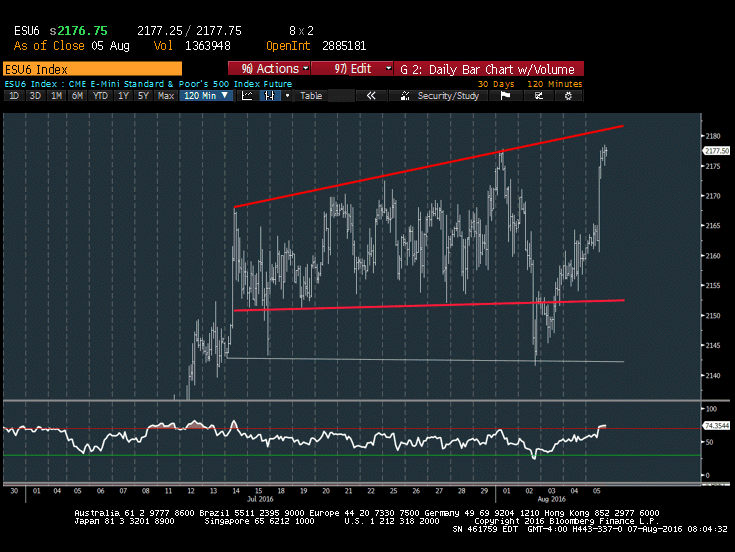
The S&P 500 Index (INDEXSP:.INX) made a solid close last Friday, returning to all-time highs. That said, the hourly charts appear to be near the highs of the recent price consolidation that have held this pattern range-bound since mid-July.
For now, the area at 2183-5 on S&P 500 futures could have some near-term importance. That said, a rally up to and slightly over 2200 can’t be ruled out into late August before any broader market reversal. Let’s dig a bit deeper to uncover what the market is telling us in this S&P 500 trading update.
Here’s a quick look at a chart of the S&P 500 Futures:
4 Key Takeaways
1. US Equity breakout in the S&P 500 and Nasdaq 100 looks to be constructive structurally. The rally should be joined by the NASDAQ Composite and DJIA into mid-to-late August before any broader market peak is in place. The S&P 500 large cap breakout has now been followed by similar moves in both the S&P Mid-cap index (MID) and Small-cap index (SML) which had been lacking before. And the Advance/Decline line (market breadth) is back at new all-time high territory, while Financials have surged to show strong outperformance along with Technology. Note that defensive sectors like Utilities, Staples and Telecomm have finally begun to wane.
While volume is seasonally light, and signs of “Jumping onboard” this rally have happened quickly, as the Equity Put/call ratio has fallen to the lows last seen in early July, we’ll need to see evidence of this rally failing before adopting any sort of cautious tone. For now, the move looks constructive and is being led by the “right” sectors which wasn’t the case back in March.
2. Financials have demonstrated a sharp rally back to new monthly highs, which managed to breakout in absolute and relative terms just in the last few days. Stocks like DFS, OZRK, BANC,JPM, TCB, KEY, FINL all look attractive, while Brokerage stocks like GS, MS are on the verge of larger trendline breakouts. Regional banks look slightly more attractive at present than some of the larger Money Center Banks – BAC, C, which are now nearing important upside resistance. The Brokerages all look to follow through higher in the next 1-2 weeks after their own recent outperformance, which in the case of GS, MS, is now testing important trendline resistance.
3. Much of this relative strength in Financials has come about due to the Global Bond selloff in the last week which has seen the US 10-year yield start to turn up a bit more meaningfully after testing 1.45%. Rallying near-term up to 1.75-1.78% wouldn’t be an abnormal technical improvement for TNX, but rather, just a bounce within an existing downtrend from late last year along with the mild pattern of lower highs in place just since this past March. Movement back over 1.80% is necessary to expect this pattern could be giving way. In the next 2-3 weeks though, a further bond selloff along with gains in Financials looks quite likely.
4. Seasonally speaking, equities are entering a bearish period which starts with the month of August. While this month is not as negative as September going back over the last 50-100 years, it HAS been the worst month in the last two decades, averaging -1.3%, far surpassing September’s -0.7% drawdown. Given that S&P finished July on a particularly strong note, higher by 2.8% while sentiment has improved, understandably, this combination of Divergences among the indices at new highs with lofty sentiment heading into a seasonally weak time is worth being a bit more selective and keeping stops tight. Swinging for the fences is no longer apropos, and hitting singles makes more sense entering August.
S&P 500 Futures Outlook (Short & Intermediate Term)
Short-term Thoughts (3-5 days) : Bullish – The S&P 500 cash index made a definitive breakout on a closing basis, yet futures lie just shy of prior intra-day peaks from last week. They are also just below the initial resistance zone targets mentioned recently at 2183-5. The fact that the Financials are participating in this move gives pause as to trying to sell into it so quickly. Many intermediate-term breakouts are now occurring in many Financials indices and ETFs on an absolute basis, and Financials remains the second largest sector as part of the SPX. In the next few days, a move up to test 2183-5 looks possible while any pullback early week should be used to buy given the structure
Intermediate-term Thoughts (2-3 months): Bearish – The combination of divergences across market indices hitting new highs, the uptick in bullish sentiment, and markets entering a notoriously bearish time seasonally makes me lean toward a pullback occurring during the August-October time frame. While momentum and market breadth remain quite positive, most of the argument for fading stocks at this time is more of a counter-trend argument. However, it hasn’t materialized in the form of stock market weakness.
Most cycles along with Demark indicators highlight the possibility of a stalling out/reversal in August. Given the fact that the major indices have moved higher into this period argues that the upcoming turn should be a reversal from market highs, not lows. Additionally, another intermediate-term concern which should be mentioned is the degree of deterioration in momentum which began last year into August lows. Even a rally back to new high territory won’t allow momentum to get anywhere near where it was back in late 2014/early 2015 and this is a 12-18 month concern. For now, for this time frame, additional intermediate-term strength still looks possible into mid-August, with key targets at 2180-5 and then 2250.
Thanks for reading.
Twitter: @MarkNewtonCMT
The author may have a position in mentioned securities at the time of publication. Any opinions expressed herein are solely those of the author, and do not in any way represent the views or opinions of any other person or entity.


