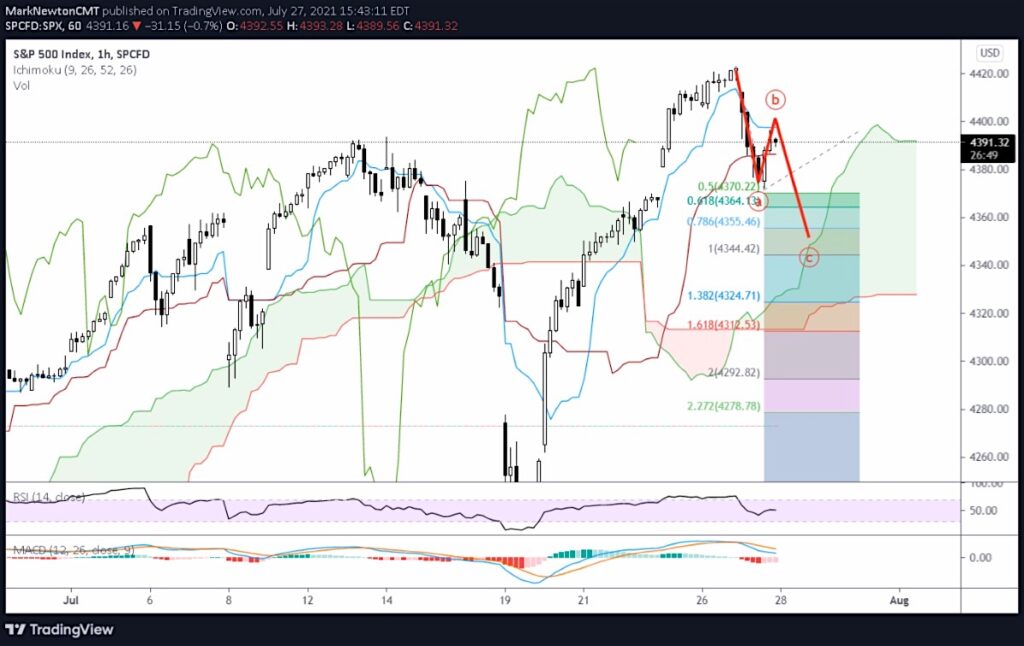
The S&P 500 Index may continue its pullback over the next 24-48 hours potentially reaching the 4340-4350 area on the cash index.
This would allow for two equal wave extensions that align right near the 50% fibonacci retracement area from the rally “up” wave last week.
It appears that Tuesday brought about the first move down, seeing price fall under the prior days lows (after seeing 5 straight up-days). To most, it seemed like a larger selloff that it was because of the relatively few down days the S&P 500 (and broader stock market) has experienced of late.
Overall, I’m viewing this decline as something to buy into this week. I would change my mind (to bearish) only if last week’s lows are broken by the end of this week. At present, it’s still right to view this weakness as something that should prove short-lived unless we see further deterioration.
S&P 500 Chart

Twitter: @MarkNewtonCMT
The author may have a position in mentioned securities at the time of publication. Any opinions expressed herein are solely those of the author, and do not in any way represent the views or opinions of any other person or entity.


