 Lots of chatter about the strength of Tuesday in 2014. According to Ryan Detrick, Tuesday’s are up 9.25% this year. And according to J. Lyon’s Fund Management, Tuesday’s performed much better during the first half of 2013 than 2014. Whether these trends hold true or not is neither here nor there to me, but interesting nonetheless. Looks like the markets may need to find some Turnaround Tuesday mojo to keep the streak alive.
S&P 500 Technical Support & Resistance Update
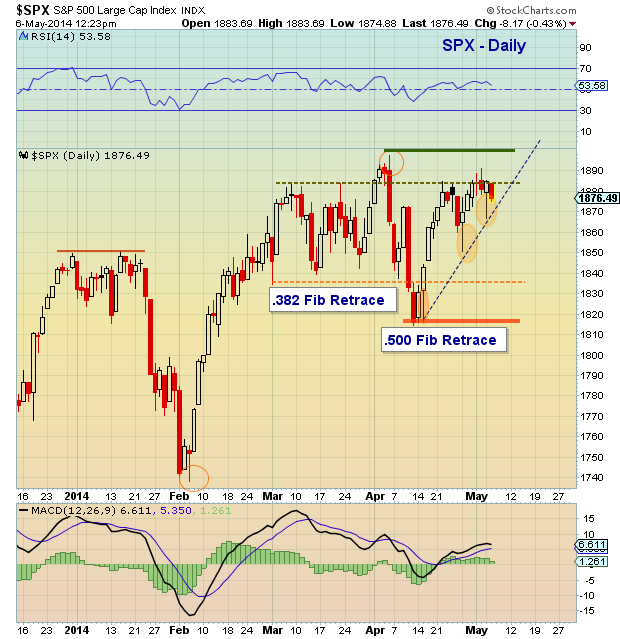
A quick look at the very near-term technical picture on the S&P 500 shows 1885 as a closing price resistance level. A close above 1885 would increase the likelihood of new highs. Of course, follow through is key. But perhaps more noteworthy are the tentatively bullish long shadows on two recent daily candles (as well as a third that started the current short-term uptrend – see chart below).
I highlighted these this morning for a two very specific reasons:
- They tend to be bullish until proven otherwise.
- The bottom wicks form the very near-term uptrend line. And considering the uncertain character of the current market terrain, the bottom of the nearest wick is likely important to near-term trading direction. The cross-section with the uptrend forms an important S&P 500 technical support level. Below that is 1850 & 1837.
Trade safe.
No position in any of the mentioned securities at the time of publication. Any opinions expressed herein are solely those of the author, and do not in any way represent the views or opinions of any other person or entity.
 Testing Important Price Support")
: Cup (and Maybe Handle) Watch")
 Trading Near Top Of Price Range")

