Quick question and thought before we dig into the S&P 500 price action. What do you want to see happen to the stock market here? I ask this with an implicit caveat: to be careful what you wish for.
I see many narratives building across social media but few driven by price action and confirmation. Sure, we could see a double top. Perhaps even a megaphone. Or a crash? Or maybe a sling shot higher that doesn’t stop until the S&P 500 hits 2000.
Although these setups are all good to be aware of, there is a very acute problem with allowing ourselves to slip into narrative promotion… it tends to lead to emotional attachment, which often often manifests itself through unhealthy trading plan adjustments based on what we want to happen rather than what is happening.
As active investors, we need a focused strategy that blocks out the noise. And for those that lean on the technical side of the equation, we need a price level to trade against (a support level where stops can be placed) and a price objective. Even more important, we need to understand how we get to that target (via confirmation).
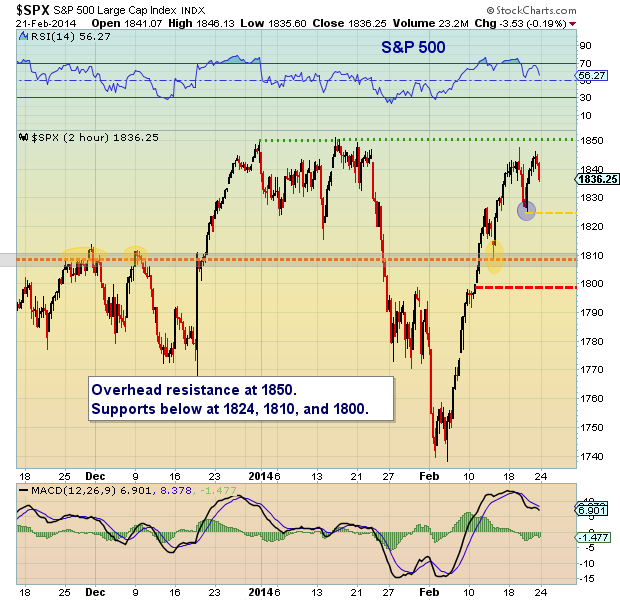
Okay, time for me to get to the price support and resistance levels that are shaping the technical picture of the S&P 500. And we’ll keep this part short and to the point (see chart below for recent price action and reference):
Resistance: 1850 is the focal point. A close above this level would likely target 1879/1895.
Support: 1824 is last week’s low and offers minor support. Below are more critical supports at 1810 and 1800.
Have a great week. Trade safe.
No positions in any mentioned securities at the time of publication. Any opinions expressed herein are solely those of the author, and do not in any way represent the views or opinions of any other person or entity.


