The S&P 500 (NYSEARCA:SPY) had been consolidating to form a bull flag at the 2780 zone… until additional trade war related news between the US and China took center stage once more.
The reaction to the news was that price broke intermediate and important price support levels around 2751-2740 on the S&P 500 Index.
Range expansion to the downside took price down to an important support level on the daily chart – 2700, which also marks the 50 SMA on the daily chart. This support held.
Quite a bit of technical damage occurred on this move lower but there is some positive divergence on Williams %R, a momentum indicator.
Price confirmation one way or the other is required on Wednesday June 27th with month end and quarter end looming.
So what gives? Let’s look at the chart and point out some things traders need to be aware of.
S&P 500 Chart
From a technical perspective, there are a few pointers that one needs to be aware of.
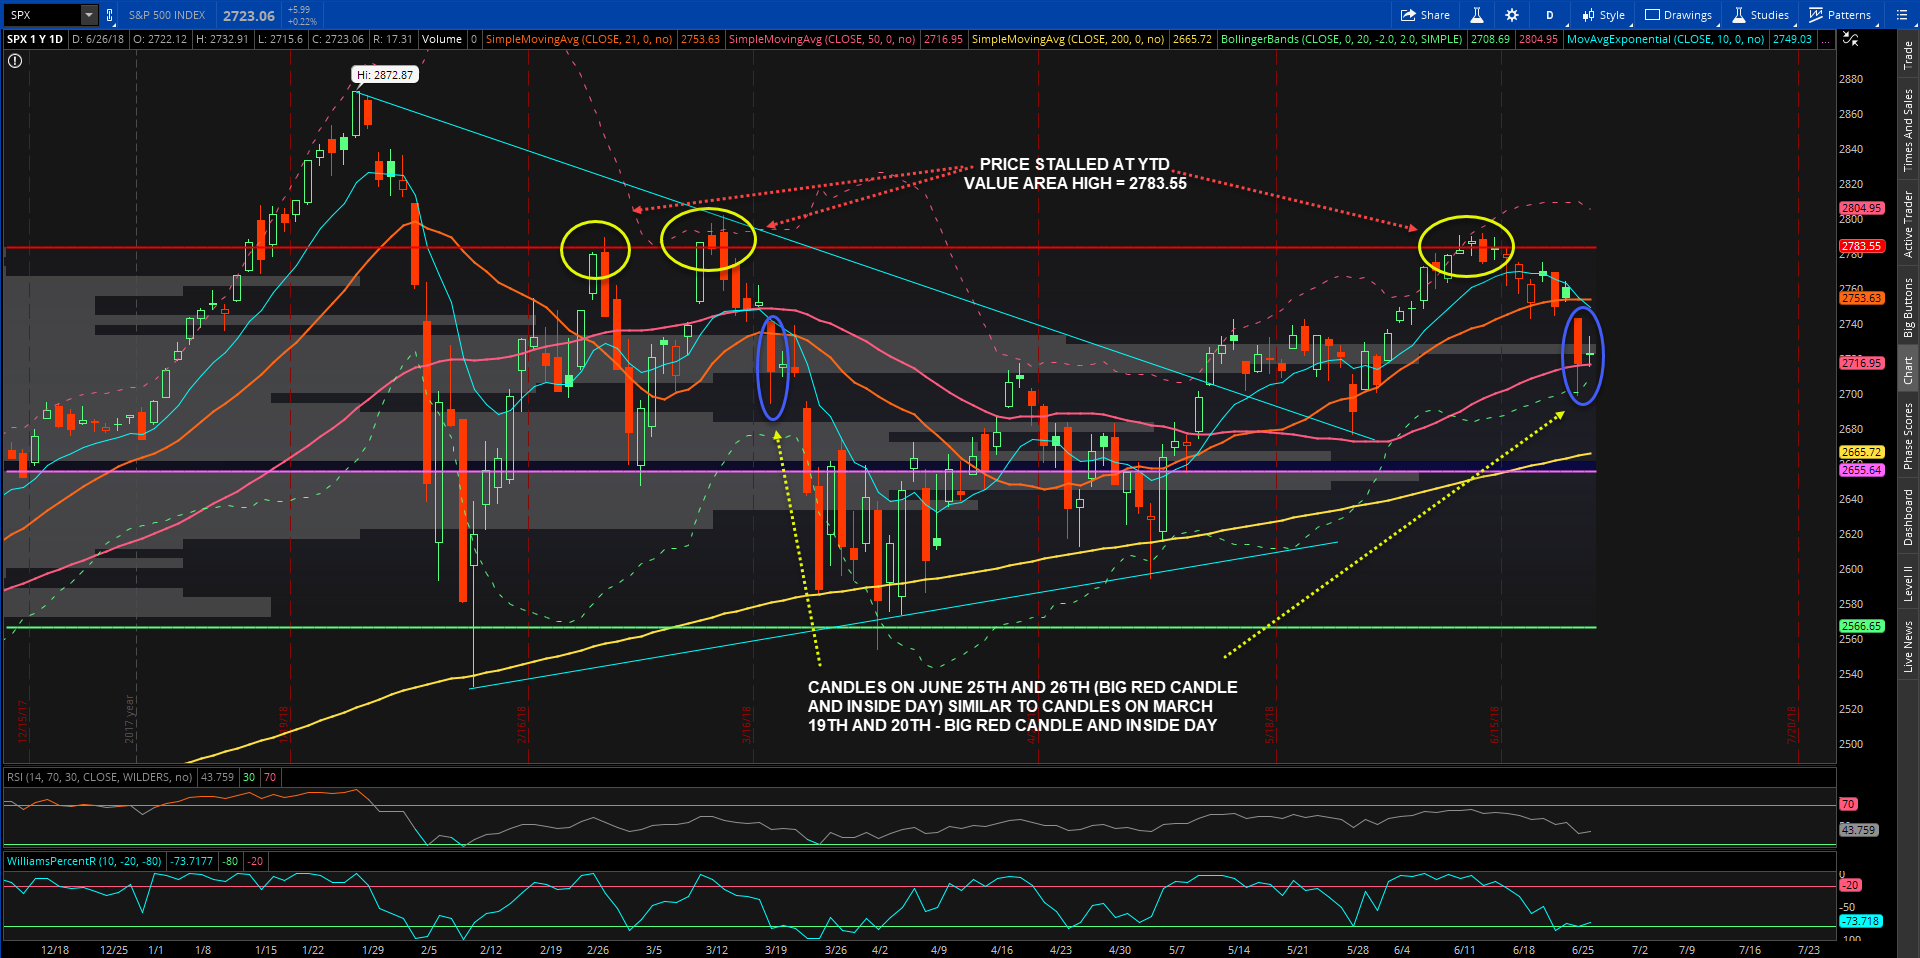
1. Price stalled again at the 2780 zone which is the Year to Date Value Area High (VAH). Price stalled similarly during the last week of February and again during the week of March 12th.
2. Inside Day or Week is a pattern that is quite powerful on either side of the tape, whether you are playing for a break higher or break down. The candle formation Monday (June 25th) and Tuesday (June 26th) is surprisingly quite identical to the ones on March 19th and March 20th when S&P 500 printed an Inside Day – a very tepid bounce after a big red day. Price broke down then. The same scenario need not occur but one needs to be aware that an inside candle can go either way.
3. The Equity only Put/Call ratio ($CPCE) printed a reading of 0.52 today (June 26th). Similar readings have been noted during the entire month and this throws utmost caution as there seems to be a lot of complacency. Of course, what price does from here can be totally opposite of what has been mentioned but after a big red day, the Options Flow indicated a lot of call buying instead of put buying. In fact, there were massive put buying in $VXX. Overall caution warranted.
4. Last but not the least, the Open Interest for tomorrow’s expiry and Friday’s expiry for $SPY indicates a potential for Delta Hedging.
Note: The author has $SPY 270 puts expiring June 29thFriday as potential hedge
Twitter: @sssvenky
The author has a position in SPY at the time of publication. Any opinions expressed herein are solely those of the author, and do not in any way represent the views or opinions of any other person or entity.

 Testing Important Price Support")
: Cup (and Maybe Handle) Watch")

