 US equities experienced a brief dip in late September-early October on feelings of benign pessimism over the country’s increasingly dire political (government shutdown) and fiscal (imminent debt ceiling breach) turmoil. At its 10/9 low, the S&P 500 (SPX) slipped as far as 1646, -4.8% off its post-September FOMC and all-time high at 1730.
Stocks quickly thought the better of their pullback after it became clear a Senate-brokered deal (albeit short-term) would avert sovereign default, though; and with that renewed optimism broad market indices are now testing their recent highs.
The reassurance that everything is (temporarily) resolved and that stocks are now free to continue inexorably higher from where they left off belies an important point: where stocks left off – as measured by the S&P 500’s nine sectors – was just below major cyclical resistance. Relative strength considerations aside, every slice of the SPX is just below or at a significant technical decision.
With the exception of Utilities (XLU) perhaps, each S&P sector chart below reflects a relatively secure rising trend on long, medium and short-term time frames; but how the resistance levels noted on each resolve will be crucial to a continuation. A breakout with minimal difficulty over these levels would have immense significance given the multi-year lead-up preceding most of them; and in a secular context this outcome is probably soon in coming.
Though overshoots often occur (running herds, silicon or carbon-based, do not turn on a dime), major ceilings such as this usually demand a reckoning before admitting passage through. Moreover, the broad coincidence of similar patterns across SPX that are occurring at a synchronized intersection of price and time suggests a major outcome is just around the corner. As these levels coming into view, it’s worth considering a major correction is possible for the S&P 500 without violating its primary up trend.
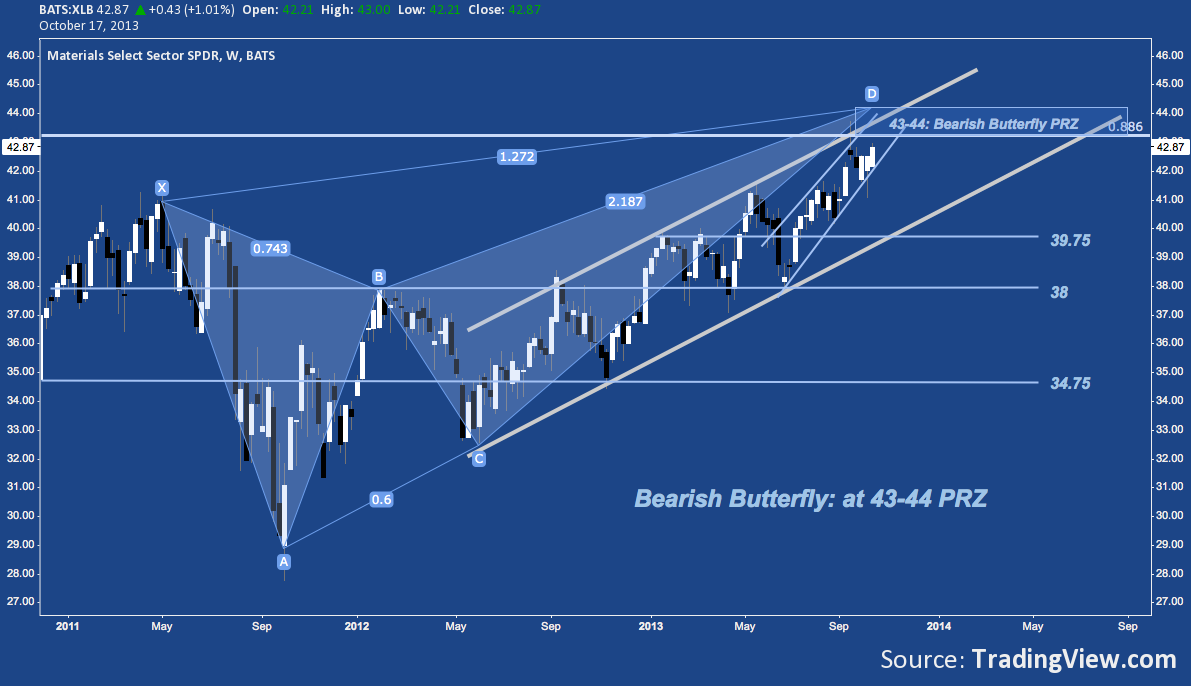
S&P 500 Sectors: Materials (XLB) – Weekly (click image to zoom)
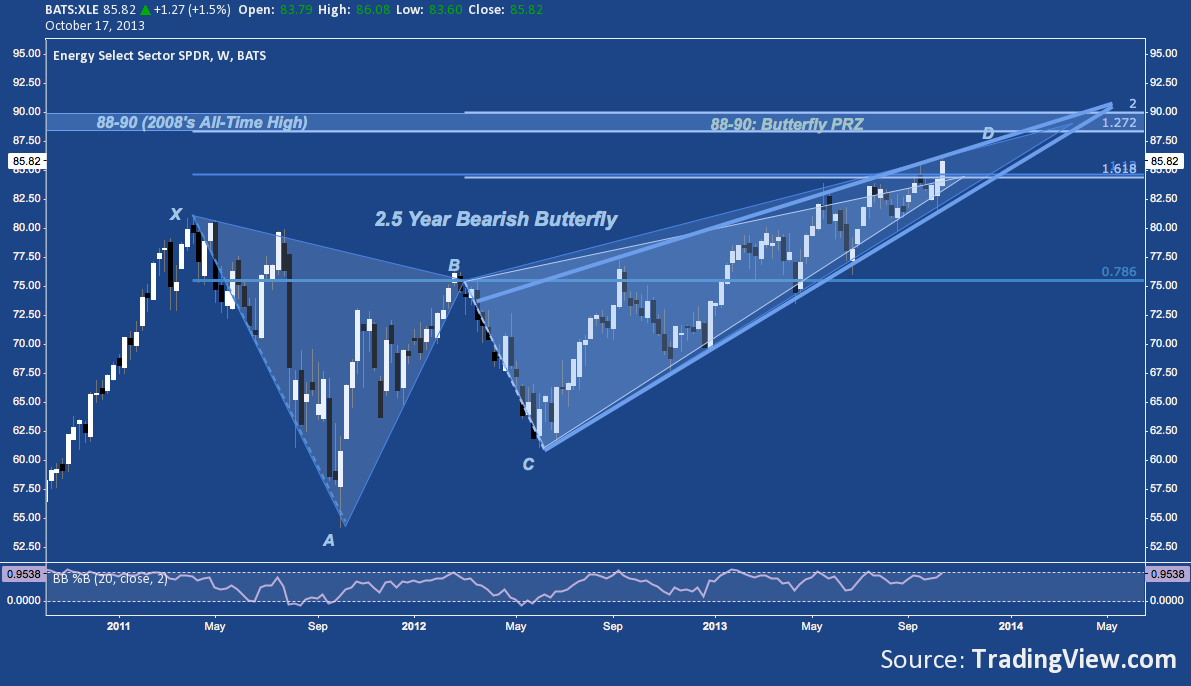
S&P 500 Sectors: Energy (XLE) – Weekly (click image to zoom)
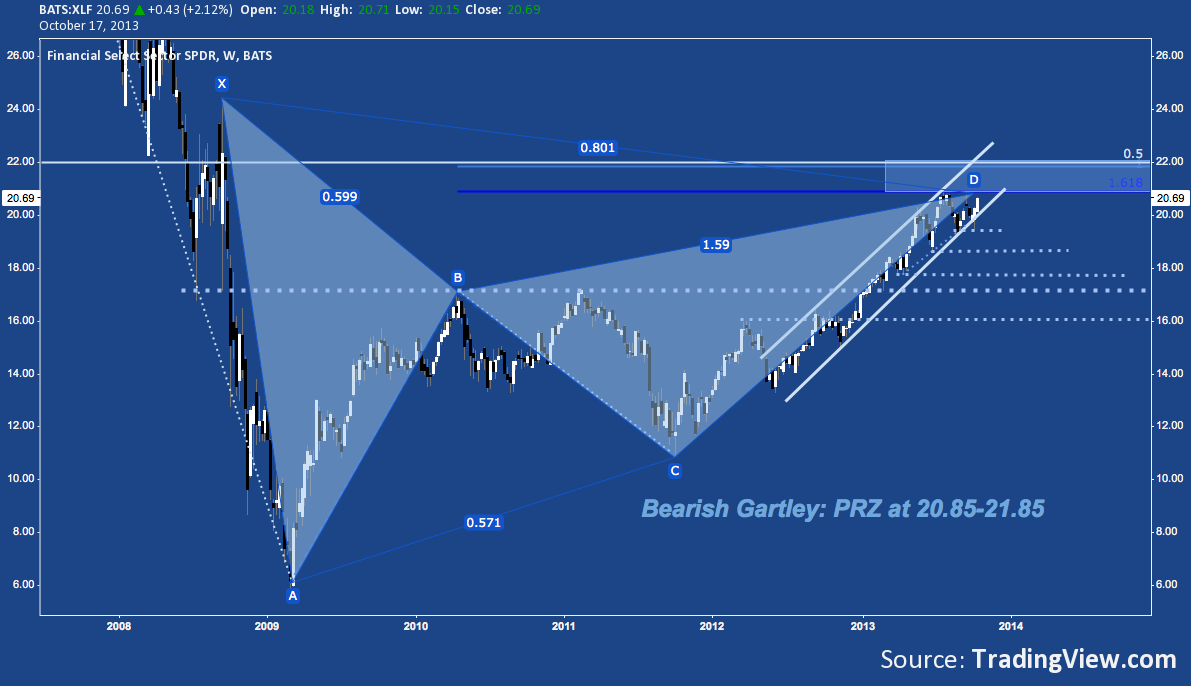
S&P 500 Sectors: Financials (XLF) – Weekly (click image to zoom)
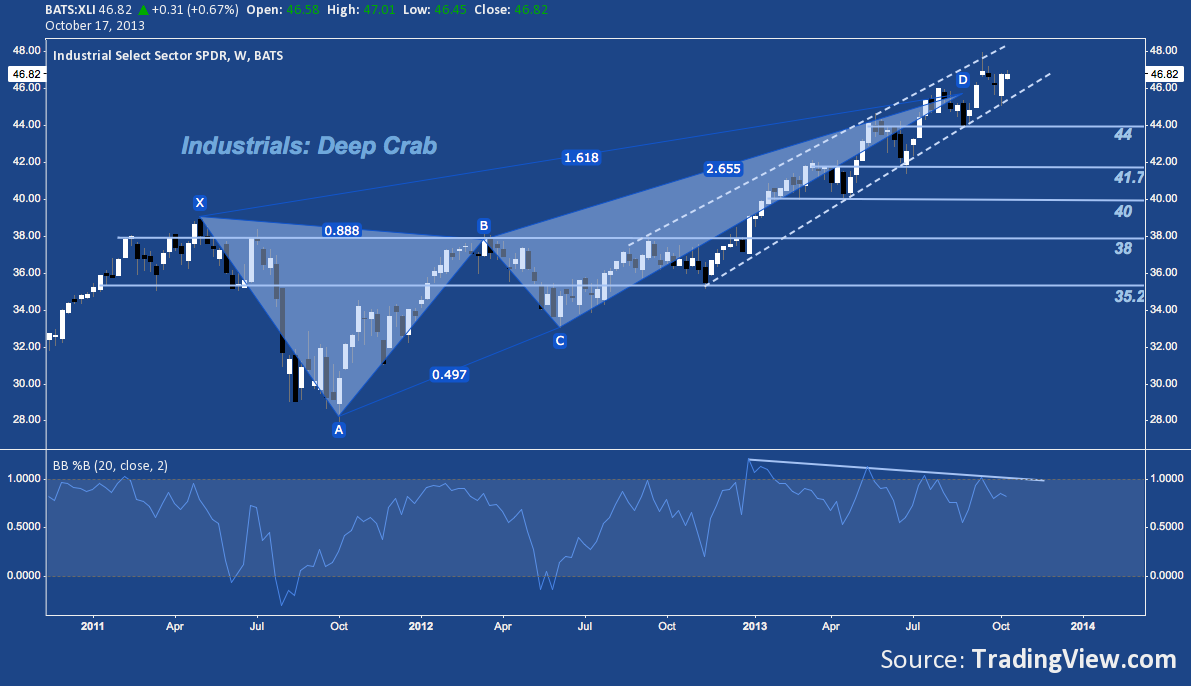
S&P 500 Sectors: Industrials (XLI) – Weekly (click image to zoom)
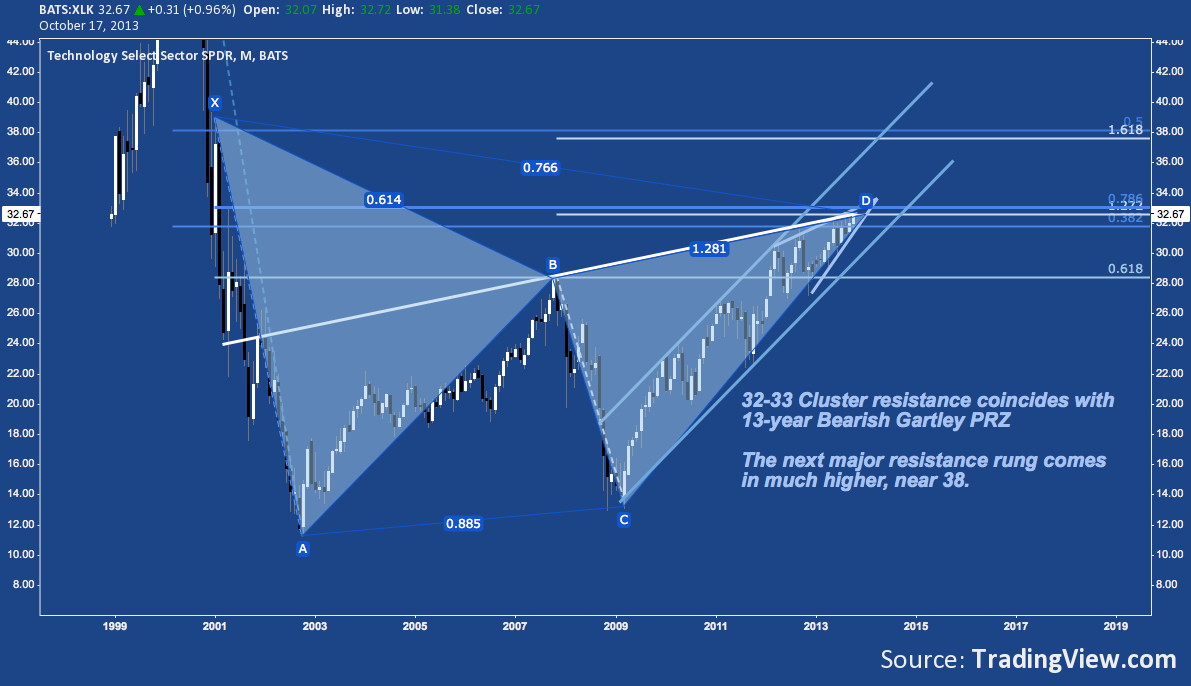
S&P 500 Sectors: Technology (XLK) – Monthly (click image to zoom)
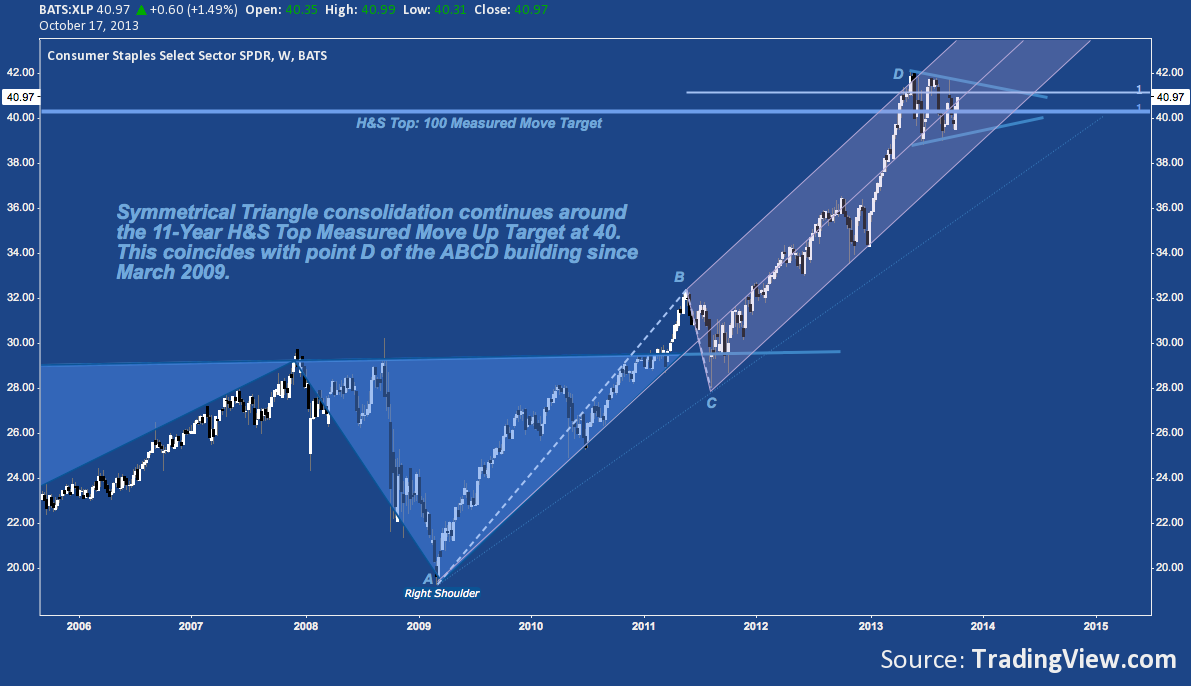
S&P 500 Sectors: Consumer Staples (XLP) – Weekly (click image to zoom)
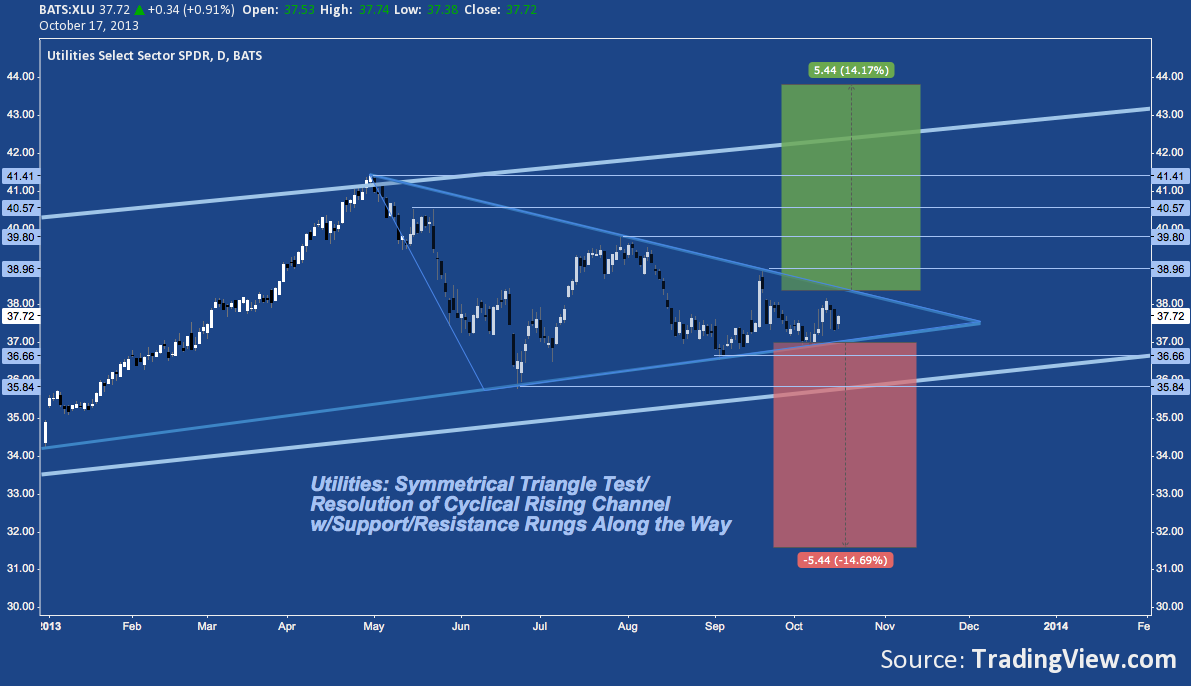
S&P 500 Sectors: Utilities (XLU) – Daily (click image to zoom)
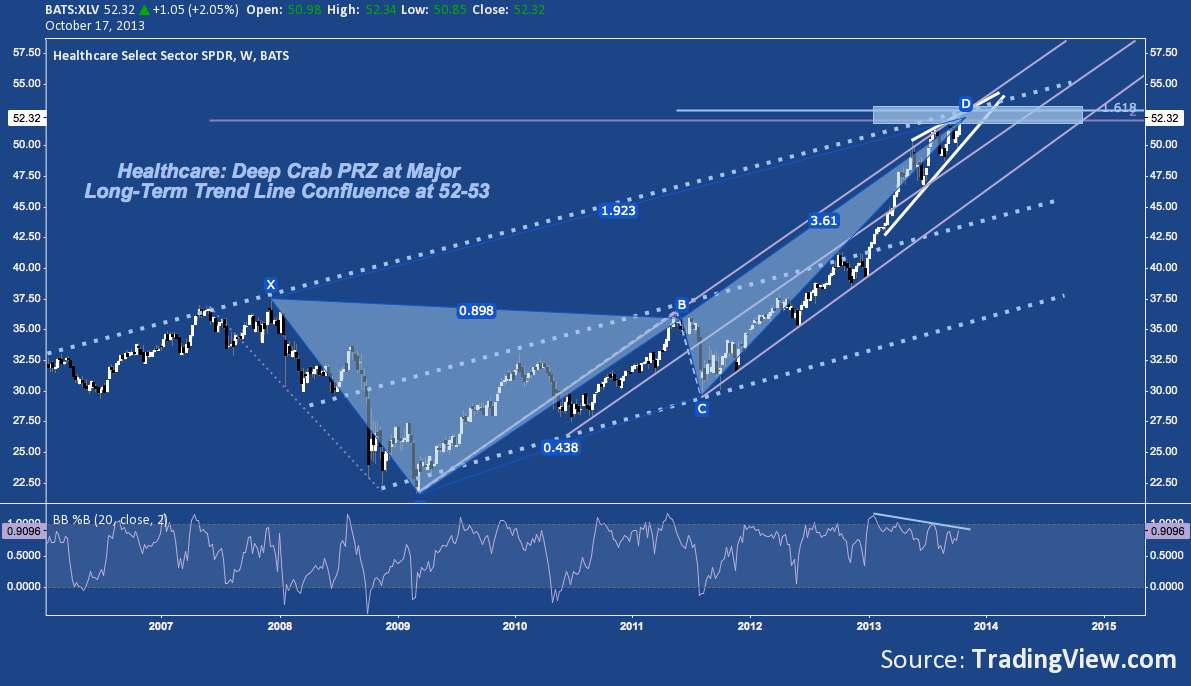
S&P 500 Sectors: Healthcare (XLV) – Weekly click image to zoom)
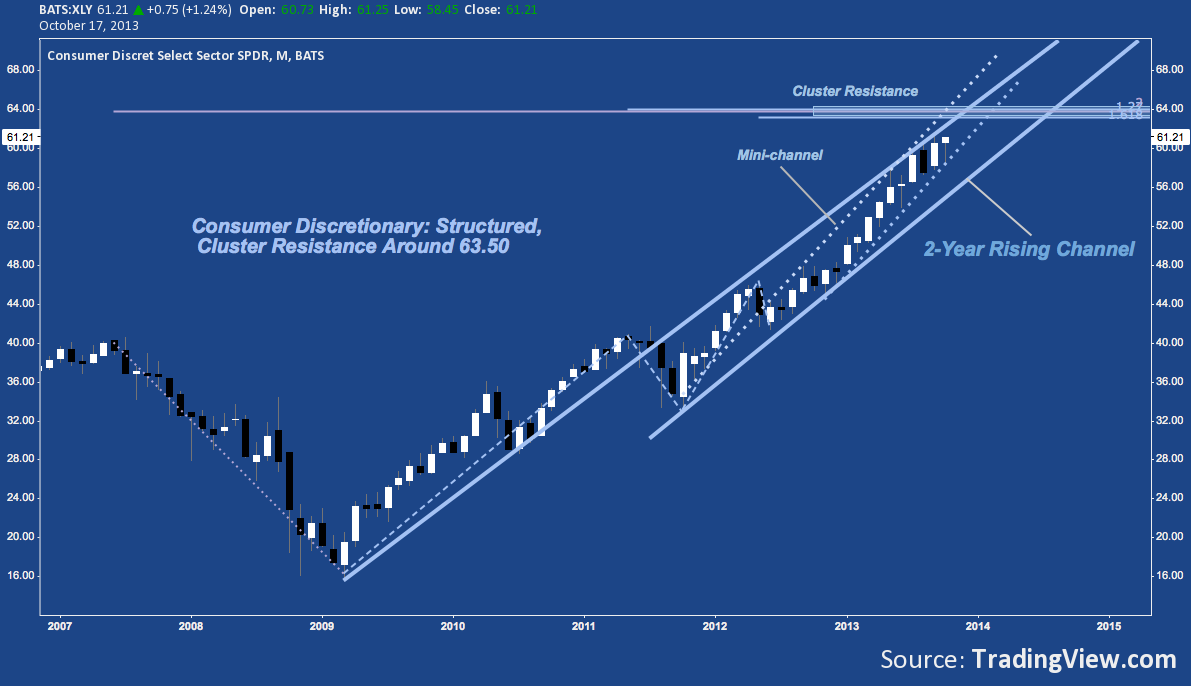
S&P 500 Sectors: Consumer Discretionary (XLY) – Monthly (click image to zoom)
Twitter: @andrewunknown and @seeitmarket
Author holds no position instruments or securities mentioned at the time of publication.
Any opinions expressed herein are solely those of the author, and do not in any way represent the views or opinions of any other person or entity.


