Want to find something bearish on the market? It’s not hard to throw a rock and find a piece of pessimistic data or commentary that will feed an equity bears appetite. I know my personal bias is to lean more cautious when evaluating the markets, but when the data that I rely on is telling me something different I must respect what its showing. That brings me to several current market breadth indicators, which are bullish from a macro level. Specifically, the Advance-Decline Line has confirmed the recent strength in U.S. equities (here and here).
If the S&P 500 Index (INDEXSP:.INX) is going to hold on to its breakout to new highs, it will need strong market breadth.
But let’s dig a little deeper. Let’s look at individual S&P 500 sector strength measured by market breadth. This will let us see if the strength in the broad market’s breadth is relying heavily on just a few sectors or if strength is stretched across the entire market.
Below I have listed the nine S&P 500 sectors using price only data (not adjusting for dividends) and their respective Advance-Decline Lines. The Advance-Decline Line simply adds and subtracts the number of stocks going up and down in a cumulative total. If more stocks are rising, the line will rise and vice versa when more stocks are declining. I use this type of indicator to understand if there’s support for an underlying price movement. If a S&P 500 Index or an ETF breaks out, I prefer to see broad participation by its underlying stocks.
S&P 500 Sector Strength Check
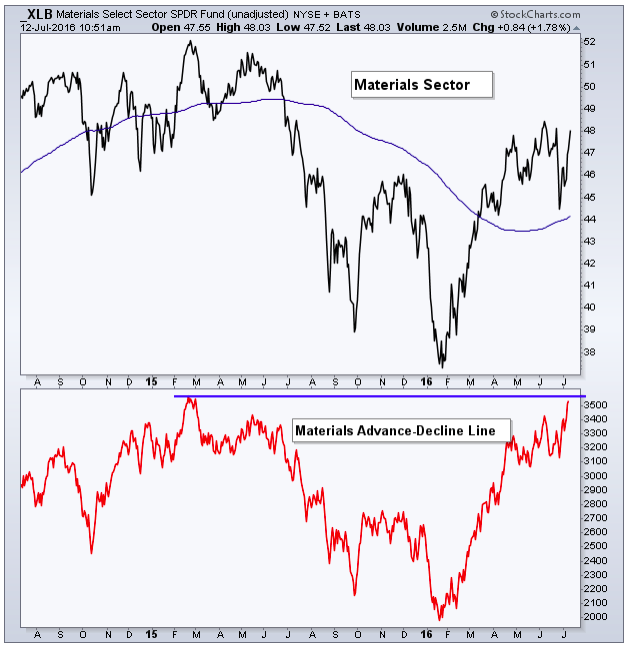
Materials Sector (NYSEARCA:XLB)
While the sector itself is still nearly 8% off its high, its respective Advance-Decline (A-D) Line is already nearly back to its prior high.
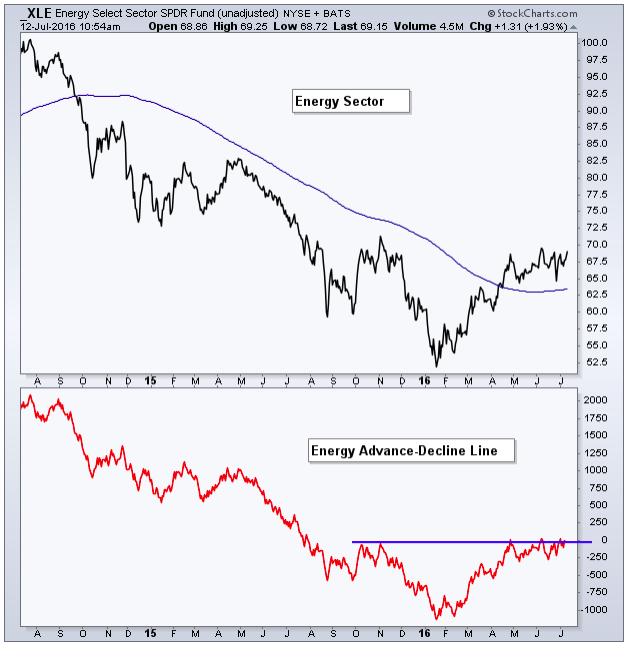
Energy Sector (NYSEARCA:XLE)
While the Energy sector ($XLE) is still in a down trend of lower highs and lower lows, it’s breadth has improved somewhat as it advances with price to challenge its prior high.
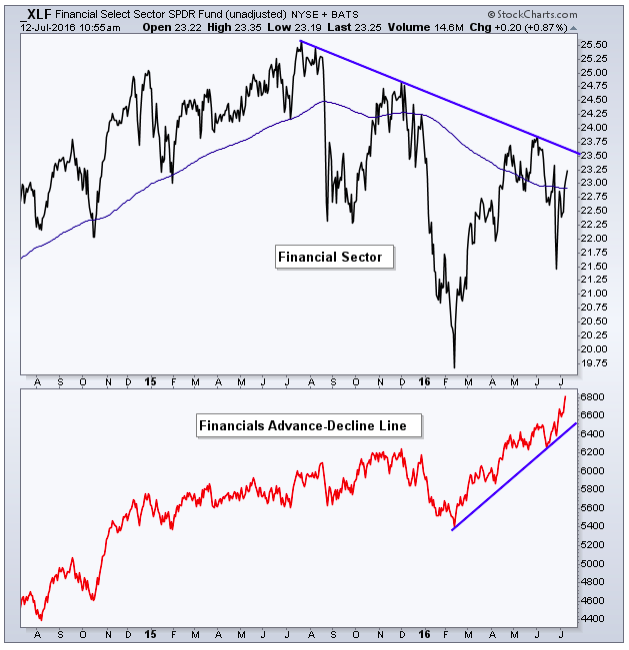
Financials Sector (NYSEARCA:XLF)
Financials ($XLF) have been one of the worst performing sectors YTD, largely attributed to the declining yield curve. However, when looking at the performance of the individual financial names, the $XLF Advance-Decline Line is already at a new high.
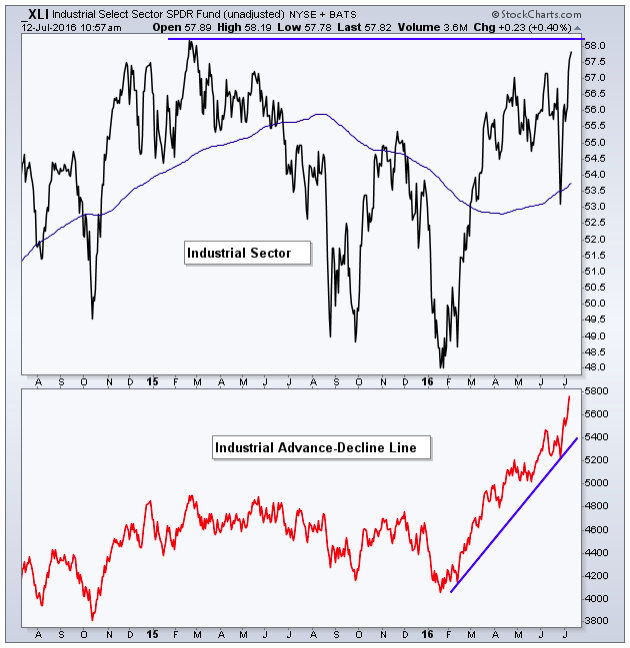
Industrials Sector (NYSEARCA:XLI)
When taking into account dividends, $XLI is already at a new high but when looking at just price it still sits a few cents under its 2015 peak. But once again, the sector’s breadth measurement has already set a new high.
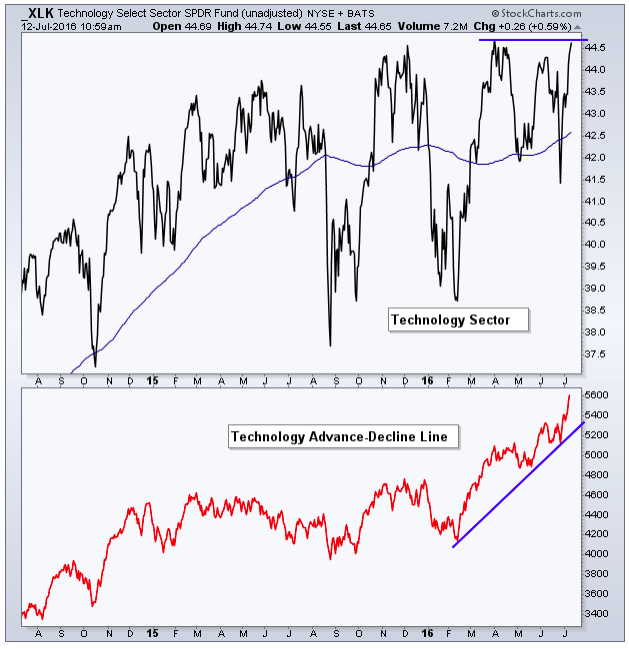
Technology Sector (NYSEARCA:XLK)
Tech ($XLK) is right at its 2016 high and is just itching to breakout and so far it has the full support of its A-D Line as it broke its April ’16 high back in June.
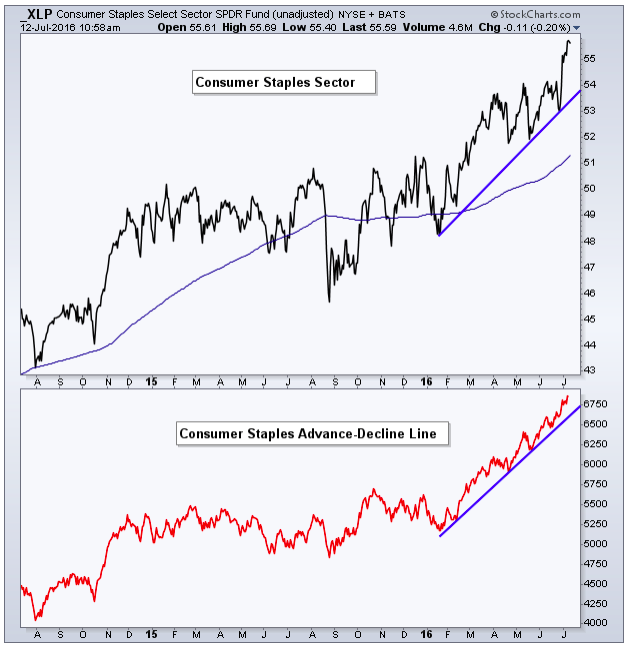
Consumer Staples Sector (NYSEARCA:XLP)
$XLP has been in a clear up trend as it makes new highs in price for the bulk of the last year. What about its Advance-Decline Line? Yep, right there with it as it marches higher.
continue reading on the next page…


