Home Investing Research S&P 500 Rally Nearing Important Trading Time/Price Area

S&P 500 Rally Nearing Important Trading Time/Price Area

0
S&P 500 Rally Nearing Important Trading Time/Price Area
s&p 500 index rally higher peak top price target chart april 8

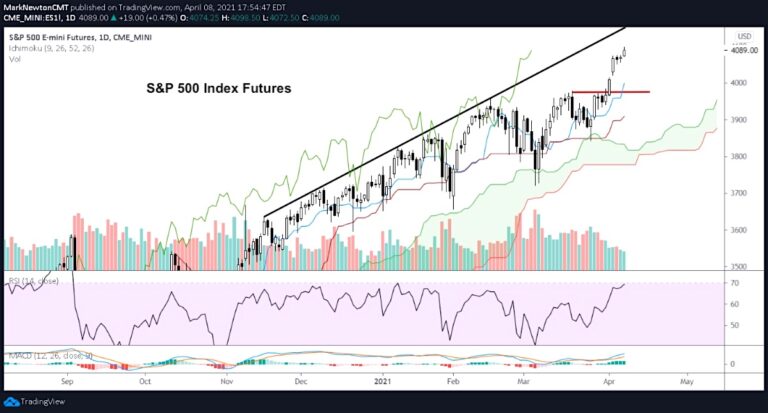
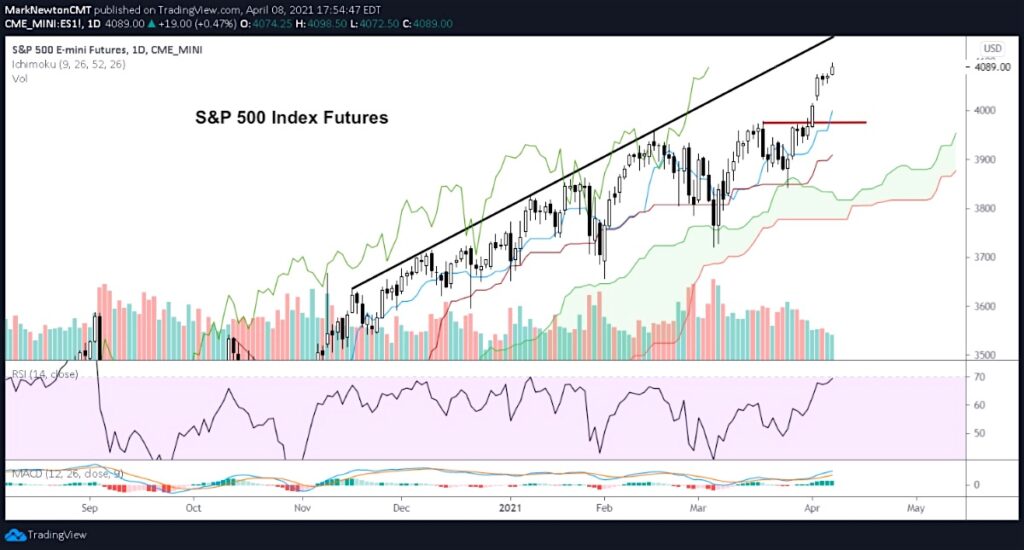
The S&P 500 Index could make an initial peak at 4100-4110.

Time-wise, this should occur Friday/Monday before a price consolidation sets in.

The key risk level to watch for any pullback on the S&P 500 futures is 3983; this level marked the high of the first move up off the March 26 low. Holding ABOVE 3983 in Futures and 398 on the S&P 500 ETF (SPY) keeps the up-trend intact and can lead to yet another rally attempt.

UNDER 3983 is bearish and suggests the possibility of a test of late March lows at 3843 and below that is 3720.

Sign up for our FREE newsletter
and receive our best trading ideas and research


Each of these price levels takes on huge importance in the weeks ahead. Initially, any consolidation is expected to prove short-lived and merely alleviate overbought conditions and would fit in with an Elliott-style “ABC” type fourth-wave pullback before a final push up. (But watching these levels and where things could go wrong.. is important). The drying up in price action and volume (despite being a post holiday week) is indeed something to pay attention to, but as always, until price turns down, it’s going to be proper to still lean long and expect 4100 is hit before much of an about-face.

If you have an interest in seeing timely intra-day market updates on my private twitter feed, please follow @MLNewtonAdvisors. Also, feel free to send me an email at info@newtonadvisor.com regarding how my Technical work can add alpha to your portfolio management process.

Twitter:  @MarkNewtonCMT

Author has positions in mentioned securities at the time of publication. Any opinions expressed herein are solely those of the author, and do not in any way represent the views or opinions of any other person or entity.

Previous article Apple Stock Price Surge Triggers Buy Signal
Next article Skyworks Stock (SWKS) Breaking Out, New Highs Likely
mark newton stock market analyst trader
Mark has more than 20 years of buy and sell-side experience in the financial services industry. He formerly served as Chief Technical Analyst at Greywolf. Prior to that he worked with Diamondback Capital Management as a technical analyst and portfolio manager, and with Morgan Stanley in New York City as their technical strategist. Before moving to the New York City area in 2004, Mark traded equity options as a market maker/floor trader at the CBOE, and worked in risk management. Mark is a member of the Market Technicians Association, and former member of the CBOE, CBOT, and PHLX. He graduated with a BS in Finance from Virginia Tech in 1991 and obtained his Chartered Market Technician designation in 2002. His expertise is primarily in using advanced methods of technical analysis to identify stocks, commodities, and currencies with above-average risk/reward characteristics that can maximize returns and minimize risk. In addition to employing standard technical tools to identify trend duration, relative strength, and momentum, Mr. Newton utilizes counter-trend analysis to identify potential trend exhaustion and reversals of trend. He appears frequently on CNBC’s The Closing Bell, BNN, FOX Business News, along with Yahoo Finance.