4 weeks ago, the stock market was in panic mode… my, oh my, how things can change fast.
But don’t let the good vibes go to your head just yet. Active investors need to fight off complacency here, as the S&P 500 knocks on an important price level.
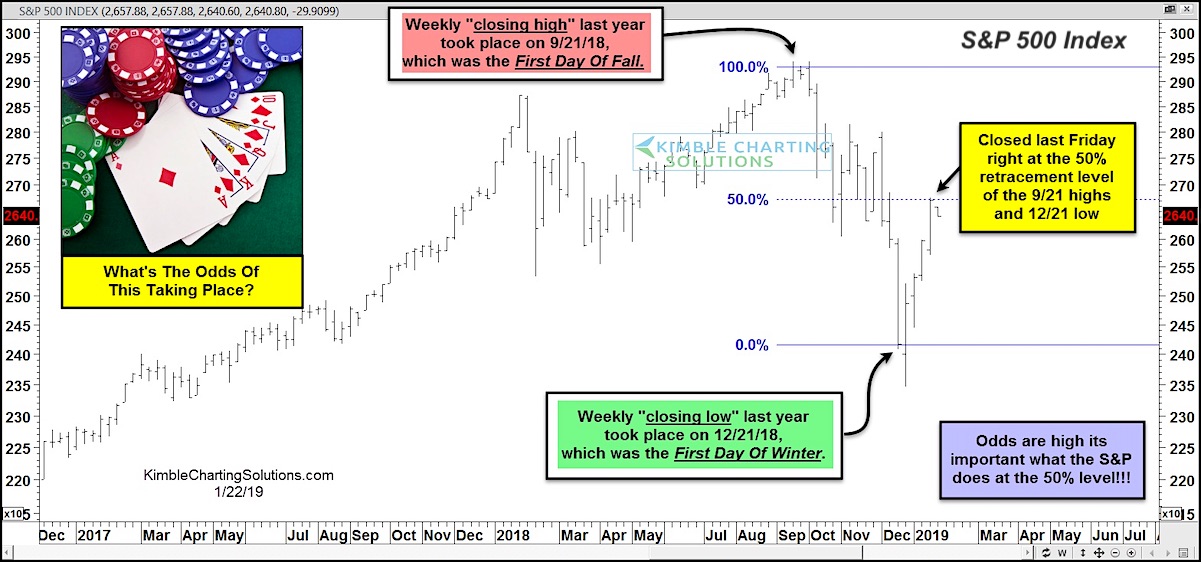
Today we focus on the S&P 500 “weekly” chart.
Note that last year’s weekly closing high took place on 9/21/18, the first day of Fall. And the weekly closing low took place on 12/21/18, the first day of Winter.
Last Friday’s weekly closing price was at the 50 percent Fibonacci retracement of those very 9/21 highs and 12/21 lows.
In my humble opinion, this level marks an important bull/bear battle ground. Breakout or breakdown? Put this one on your radar!
S&P 500 Index “Weekly” Chart
Note that KimbleCharting is offering a 2 week Free trial to See It Market readers. Just send me an email to services@kimblechartingsolutions.com for details to get set up.
Twitter: @KimbleCharting
Any opinions expressed herein are solely those of the author, and do not in any way represent the views or opinions of any other person or entity.


