Unless something dramatic happens over the coming days, the S&P 500 (SPX-Quote) will finish another year solidly in the green. The relentless drive higher for U.S. equities has carried right through the holidays and looks poised to challenge two key S&P 500 price targets into 2015.
That being said, let me add a bit of caution that (in my view) geopolitical and financial market risk is a bit elevated, so even as the U.S. stock market continues to grind higher, it is a good idea to actively manage risk and remain flexible.
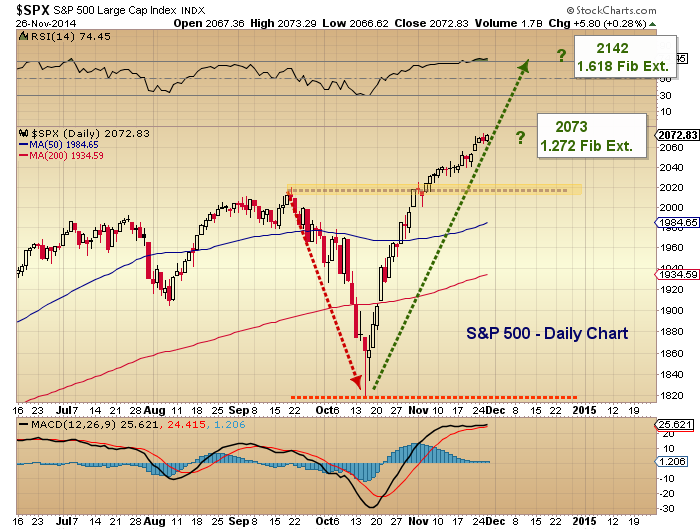
In addition to traditional technical tools like relative strength, trend lines, and support and resistance, I also like to use Fibonacci extensions. In late November, I shared a chart highlighting the Fibonacci extension targets – 2073 (1.272 Fib) & 2142 (1.618 Fib) – off the early November breakout… the chart is shown again below.
At the time, the S&P 500 was touching up against the 1.272 Fib and I cautioned that it may act as resistance. The S&P 500 reached an intraday high of 2079.47 on December 5th, before pulling back around 5 percent.
S&P 500 Price Targets Chart with Fib Extentions (from November 27)
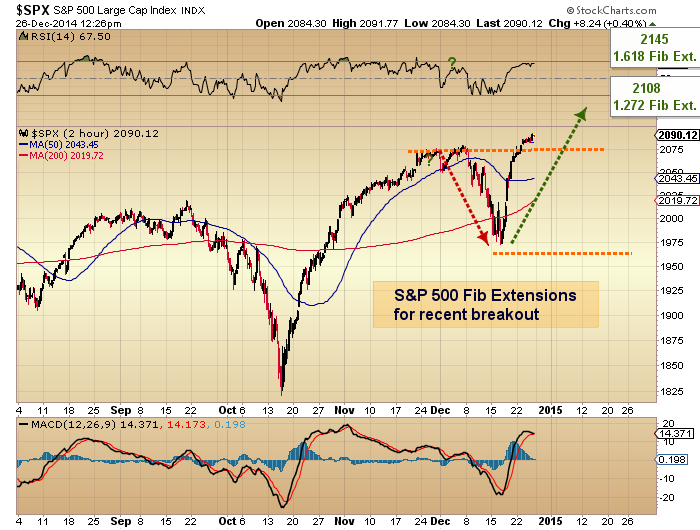
Fast forward to today, and I’m once again using Fibonacci Extensions to gauge potential S&P 500 price targets. Looking at the most recent breakout to new highs (from the December lows), we can project potential targets to trim risk into. Currently, the 1.272 Fibonacci Extension targets 2108. Note we are fast approaching this target and it may once again slow the rally or cause a pullback. The 1.618 Fibonacci Extension comes in at 2145. Note that this is in line with the 1.618 Fib price target off the October lows (listed above). So 2140-2145 should serve as strong resistance (if the index gets there on this move higher).
S&P 500 Price Targets / Resistance Into January 2015
Traditional indicators continue to indicate that the risk of a major pullback is growing. As a trader, I am respecting the near-term price action, while mitigating risk with smaller, quicker trades and by adding hedges (or reducing exposure) to swing positions in Index ETFs as we near key technical resistance (such as the price targets listed above). The stock market is an inexact science but what helps us manage our trades and investments is a good plan. Stay focused. Thanks for reading.
Follow Andrew on Twitter: @andrewnyquist
The author carries both long and short trading exposure to S&P 500 related securities at the time of publication. Any opinions expressed herein are solely those of the author, and do not in any way represent the views or opinions of any other person or entity.


 Testing Important Price Support")


