THE BIG PICTURE
The major stock market indices closed last week slightly lower than the weekly open. Volume was average and no major gaps opened up.
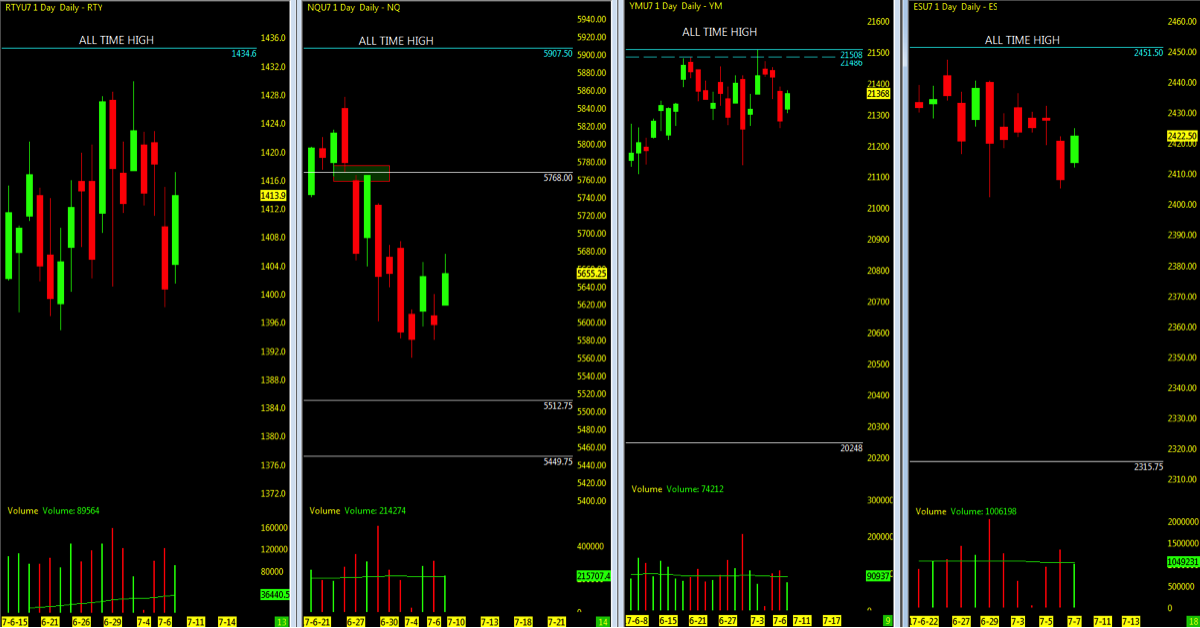
But traders are heading into a new week… and its time for a check-up on the Nasdaq (INDEXNASDAQ:.IXIC), S&P 500 (INDEXSP:.INX), Russell 2000 (INDEXRUSSELL:RUT). Market futures trading outlook at a glance:
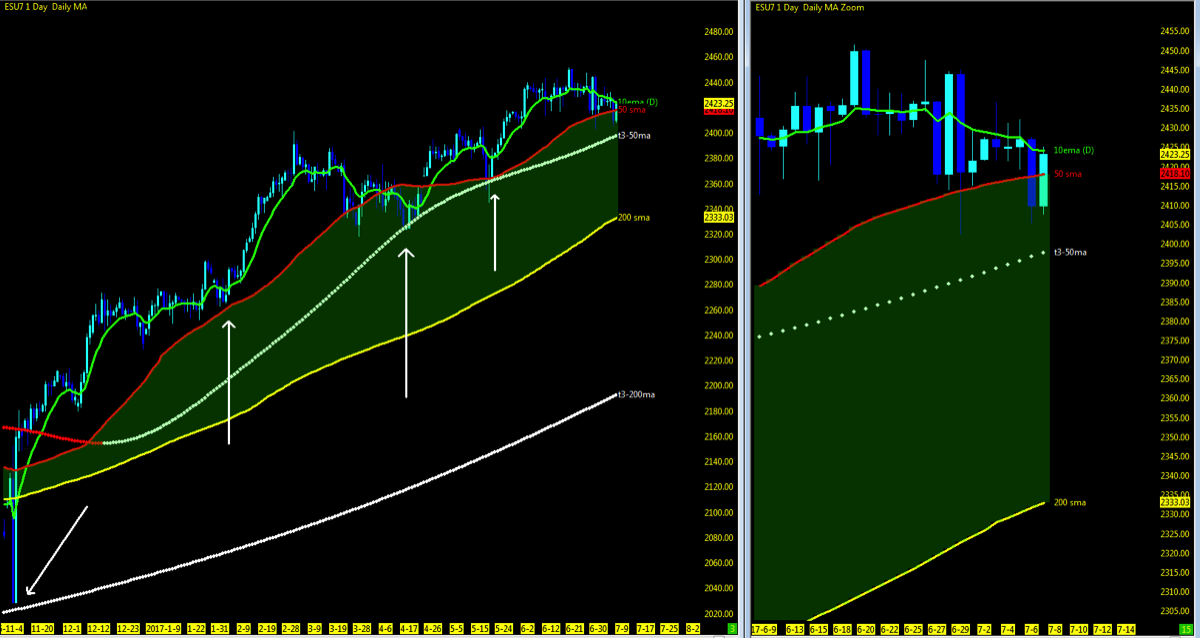
The S&P 500 regained the 50 day moving average after briefly losing it. S&P 500 futures closed out the week in the 10/50 day ma zone as it remains in 6 weeks of consolidation (2nd chart).
What Lies Ahead?
VIX levels remain low as we head into week 28 as the RTY (CME Russell index) joins the ranks on Monday (see chart analysis below). Summertime momentum at its best in the AM session as we roll into earnings season to paint the big picture for the cause to remain at the highs or market correction. Permabears not gone and still beating on the drums that the pullback is-a-coming.
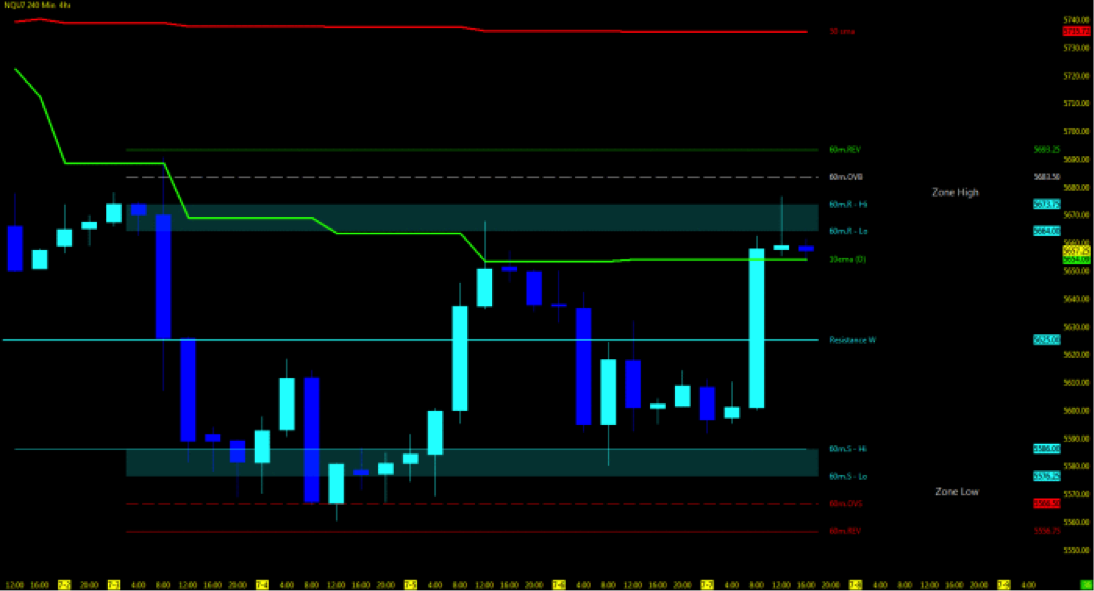
FANG/FAAMG stocks remain downside from the highs as the NQ steadies itself into consolidation between the highs of June and the April open gaps right below.
Technically, the indices open gaps remain below and viable targets for a pullback on all three (NQ/YM/ES) as not enough data on the RTY exists as of yet. The ES/YM further downside may be the short-term targets as price action holds to the moving averages with some evidence of weakness. NQ targets downside easily reachable in 1-2 sessions. As always be ready for both directions in the unpredictable market.
Key events in the market this week include Fed Speakers, YELLEN testifies, and earnings season approaching.
Technical momentum probability REMAINS in a UPTREND on the bigger pic as we hold above the key moving averages but with caution as the 50ma is in the zone of Friday’s close on the NQ/ES and RTY. As always, BEWARE of the catalyst wrench (Washington Politics) that looms overhead of if and when the market may sell off in reaction to unsettling news.
THE BOTTOM LINE
Still watching for a summer pullback/correction and then regain traction back upside.
The Nasdaq remains key. NQ losing support at the 50ma and closing out the week at the 10ema in consolidation. Continue to monitor for momentum to the open gaps below if unable to break upside above the 10ma. Upside momentum needs to regain back above the 50ma to the MML zone high.
MARKET FUTURES TRADING OUTLOOK BY EQUITY INDEX – JULY 10
Nasdaq Futures (NQ)
Technical Momentum: UPTREND Pullback/Consolidation
Using the Murray Math Level (MML) charts on higher time frames can be a useful market internal tool as price action moves amongst fractal levels from hourly to daily charts. Confluence of levels may be levels of support/resistance or opportunities for a breakout move.
Multiple MML Overlay (DAILY )
- Lowest Open Gap: 4017
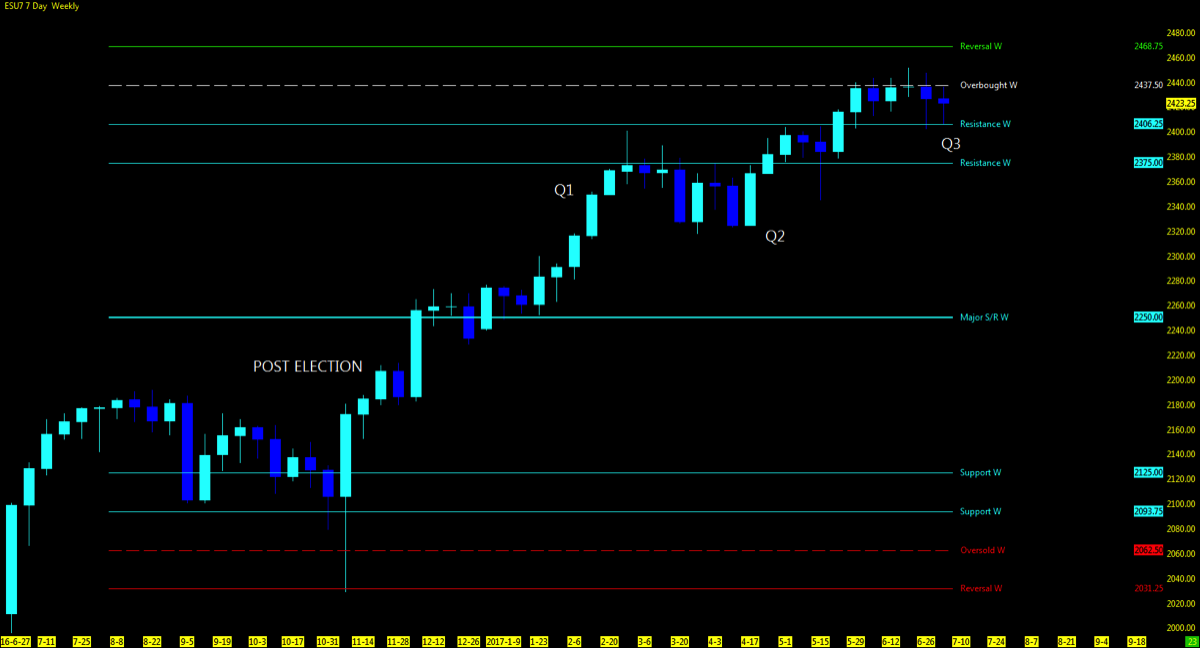
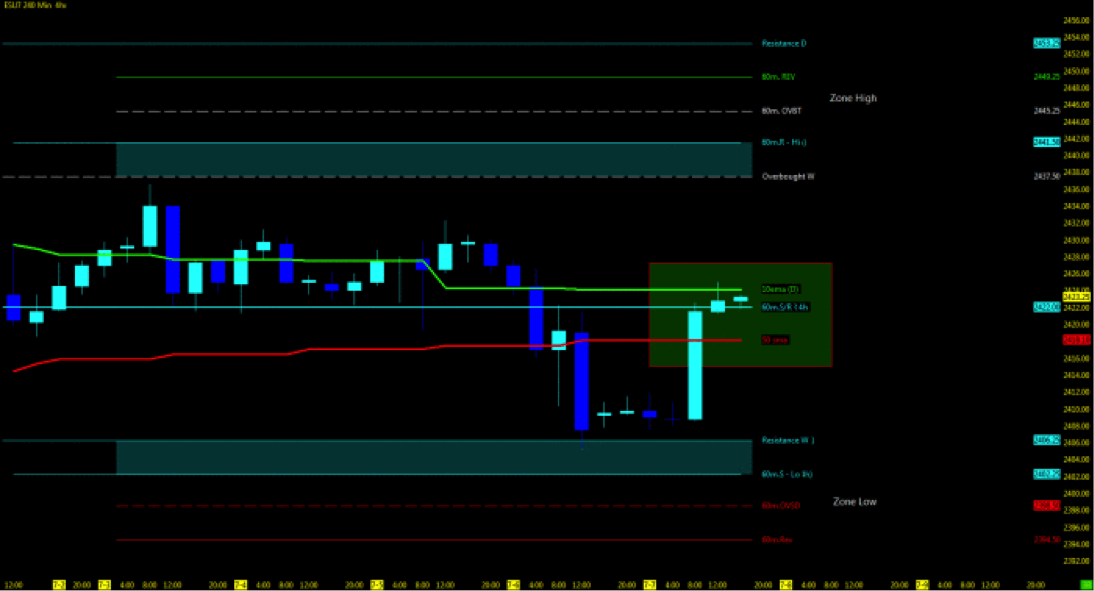
S&P 500 Futures (ES)
Technical Momentum: UPTREND Consolidation
Multiple MML Overlay (DAILY )
- Lowest Open Gap: 1860.75
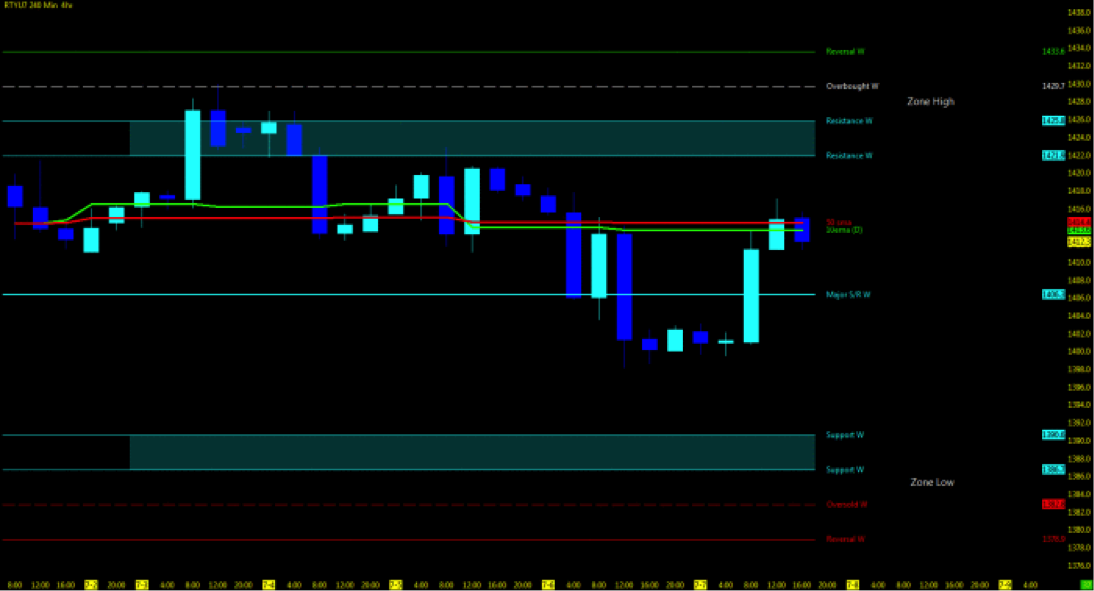
Russell Futures (RTY – CME)
Technical Momentum: UPTREND Consolidation
Multiple MML Overlay (DAILY)
- Lowest Open Gap: NONE
Thanks for reading and remember to always use a stop at/around key technical trend levels.
Twitter: @TradingFibz
The author trades futures intraday and may have a position in the mentioned securities at the time of publication. Any opinions expressed herein are solely those of the author, and do not in any way represent the views or opinions of any other person or entity.


