The bid under the S&P 500 has been relentless this year. Or so it seems. The S&P 500 is up just 3.1 percent but it seriously feels like it should be up 10 percent or more. Simply because it won’t go down, even when it feels like it should.
Odd, but let me walk through a few reasons.
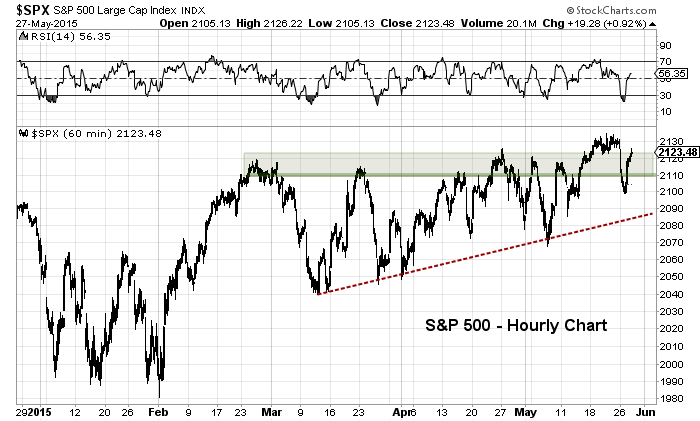
1. It feels like the forever bid to nowhere (or at least until it goes somewhere). Boring day on top of boring day. Just enough to keep the market elevated but not enough to break out… yet. The S&P 500 is back near the highs again – this is the seventh time in the past 3 months that the index has eclipsed the 2110 mark. Will enough pounding on that resistance open up a break out higher?
Is this where I’m supposed to say “Never short a dull market”. Or is this the market that is getting heavy because it cannot break out? I’m really not sure. Like many others, I’m waiting for some follow through conviction. And in the mean time, I’m focusing on taking what the market will give me. No need to guess or press.
2. BUT every time the bears think that a deeper pullback is beginning, the market recovers. But at the same time, the recoveries are just enough to grind the market slowly back up from where it came. Tough game to play for all involved. Note as well that the only time in recent memory that the market tried to squeeze a 10 percent correction out of stocks was back in October… and new highs came just as fast.
3. It appears that the market is correcting through time as opposed to price. Taken in a broader context, this doesn’t rule out another pullback (or even a significant one). It just means that a prolonged bear market may not be ready to hit just yet.
Let’s take a look at a chart of the S&P 500. As you can see, the index remains elevated.
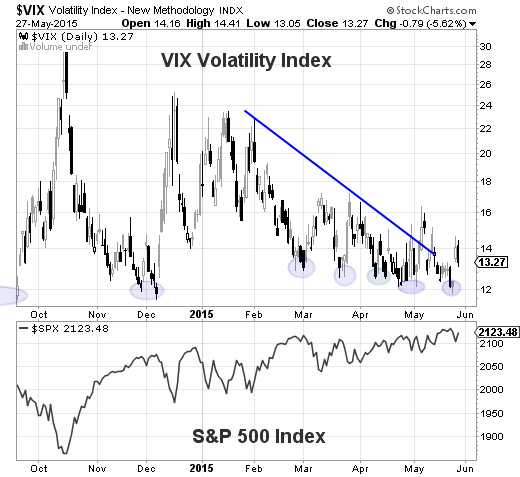
Another chart that is interesting pertains to the S&P 500’s inability to break out (cleanly) to new highs. It seems that every time the Volatility Index (VIX) dips below 12, the market gets grumpy. Not enough to do serious damage, but enough to start the grinding process over again.
The takeaway here is that the market hasn’t given us a clear signal yet. But the ball is back in the bulls court with the S&P 500 sitting near all-time highs. Will they fumble again?
Twitter: @andrewnyquist
The author does not have a position in any of the mentioned securities at the time of publication. Any opinions expressed herein are solely those of the author, and do not in any way represent the views or opinions of any other person or entity.


