The past 3 weeks has seen the S&P 500 Index zoom higher by more than 200 points. The rally has brought the index back to within 3 percent of its all-time highs and has the bulls feeling much better.
I thought this would be a good time to review what’s happened in the stock market since my last post here while providing a new market update using my Fibonacci method. I’ll also confirm my upside price target.
Feel free to reference my previous analysis of the S&P 500 (from September). Since that post, here’s what happened with the main stock market index:
- On September 29th, price tested the previous low of 1867.01, putting in a low of 1871.91.
- The S&P 500 is up +10.85% from the current low; the close Friday, October 23rd being 2075.15.
- An open gap has been closed at 2035.73.
- Two nearby open gaps are at 2079.61 and 2096.92
- Price is only 2.87% from the all time high.
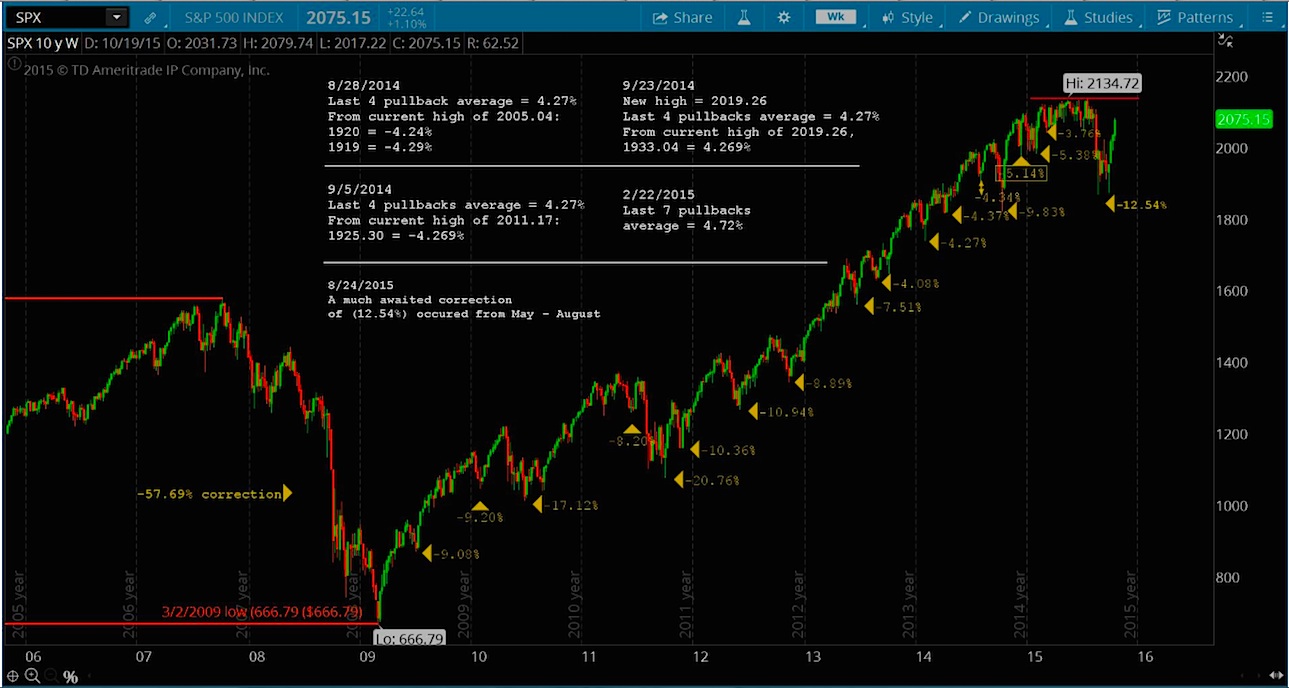
S&P 500 Index – 10 year, Weekly Chart
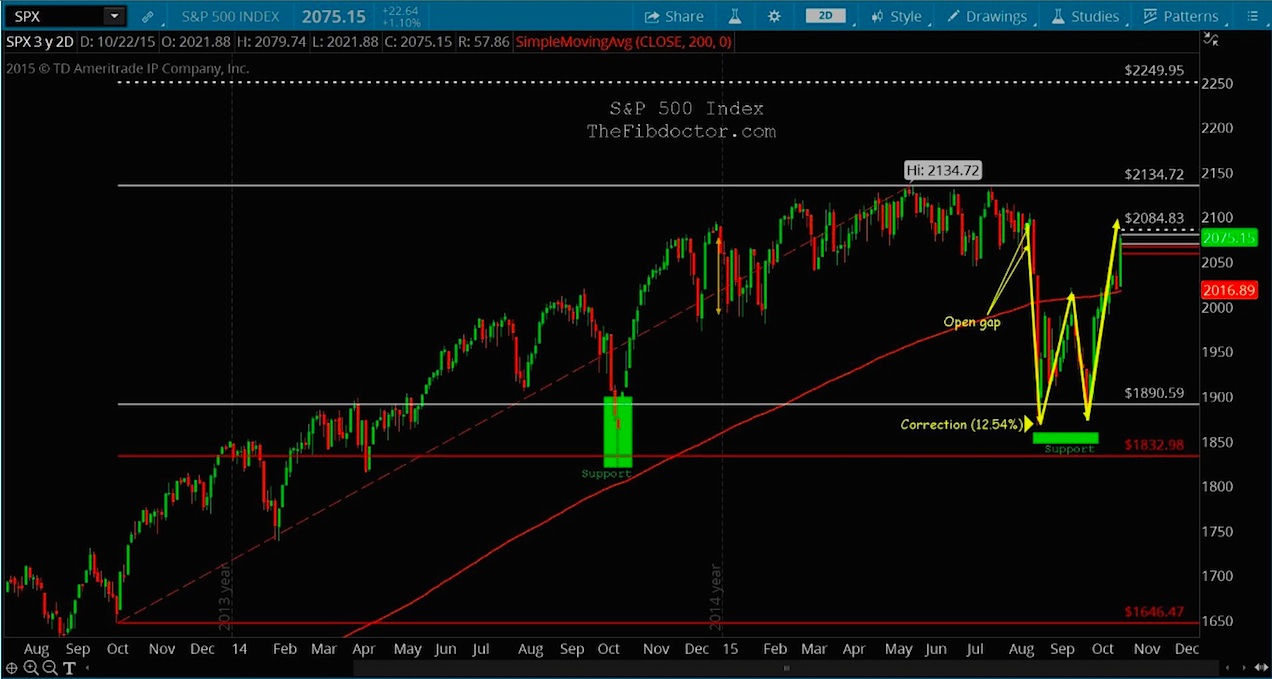
Going forward, I expect the two open gaps to be closed with the closing of the 2nd gap at 2096.92 putting us within striking distance of the all time high. I would expect some resistance as we approach 2134.72 but still maintain my price target of 2249.75 as shown in the 2 year chart below. I’ve also highlighted in green where support has been tested and held.
S&P 500 Index – 2 year, Daily Chart
Thanks For reading and always use a stop!
Twitter: @TheFibDoctor
No position in any of the mentioned securities at the time of publication. Any opinions expressed herein are solely those of the author, and do not in any way represent the views or opinions of any other person or entity.


